


Visual Management in Lean: Tools, Boards & Real-World Examples
| Audience: | Manufacturing Managers, Healthcare Administrators, Operational Excellence and Lean Management Practitioners, HR Coordinators, Organizational Leaders |
| Last updated: | November 20, 2025 |
| Read time: | 11 mins |


- How to improve team coordination and reduce bottlenecks with visual tools
- How to build standard work and reinforce best practices with clear cues
- How real frontline leaders use Visual Management to solve problems faster
What is Visual Management?
Visual Management is a system that uses visual signals, think of boards, signs, and lights, to communicate crucial information clearly and quickly. It helps everyone, from the shop floor to the boardroom, understand the status of operations, identify potential issues, and take corrective actions.
Driven by its philosophy of continuous improvement, Toyota was one of the pioneers in visual management in the 1930s. It has since become the gold standard in Lean worldwide, aided partly by technological solutions that record process data and automate routine functions.
What is a Visual Management system?
A Visual Management system is an organized set of tools, displays, and processes that make key operational information visible and accessible where work happens.
It helps teams understand real-time performance, detect problems early, and maintain standard work without relying solely on verbal communication or reports.
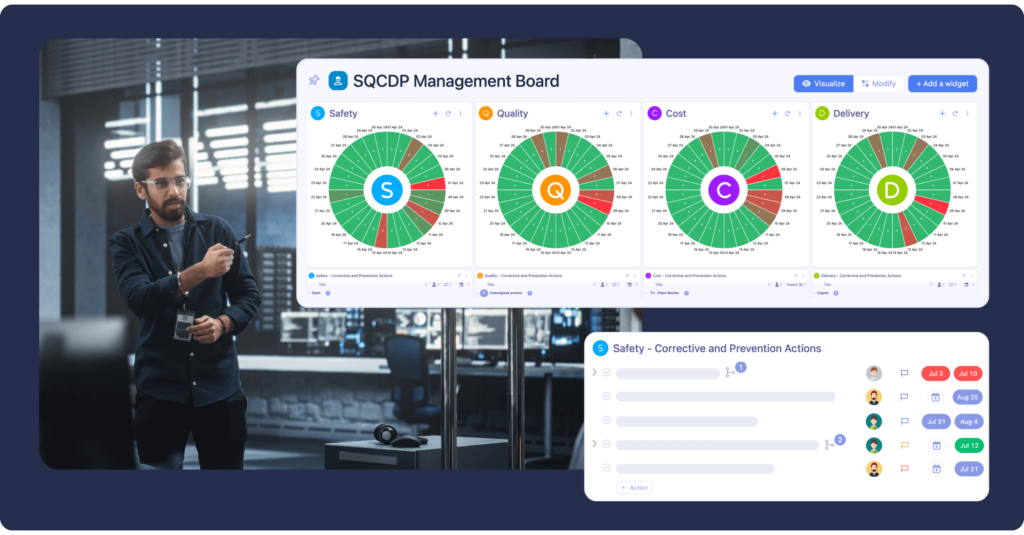
A Visual Management system typically includes elements like performance dashboards, SQCDP boards, color-coded workflows, and visual action lists positioned in strategic areas of the workplace.
Whether physical or digital, the system’s purpose is the same: to empower teams with instant access to the information they need to monitor, act, and improve their daily operations.
Benefits of Visual Management
The overarching benefit of Visual Management is its impact on production scheduling, which directly impacts speed to market. But the benefits don’t stop there. Visual Management also helps with:
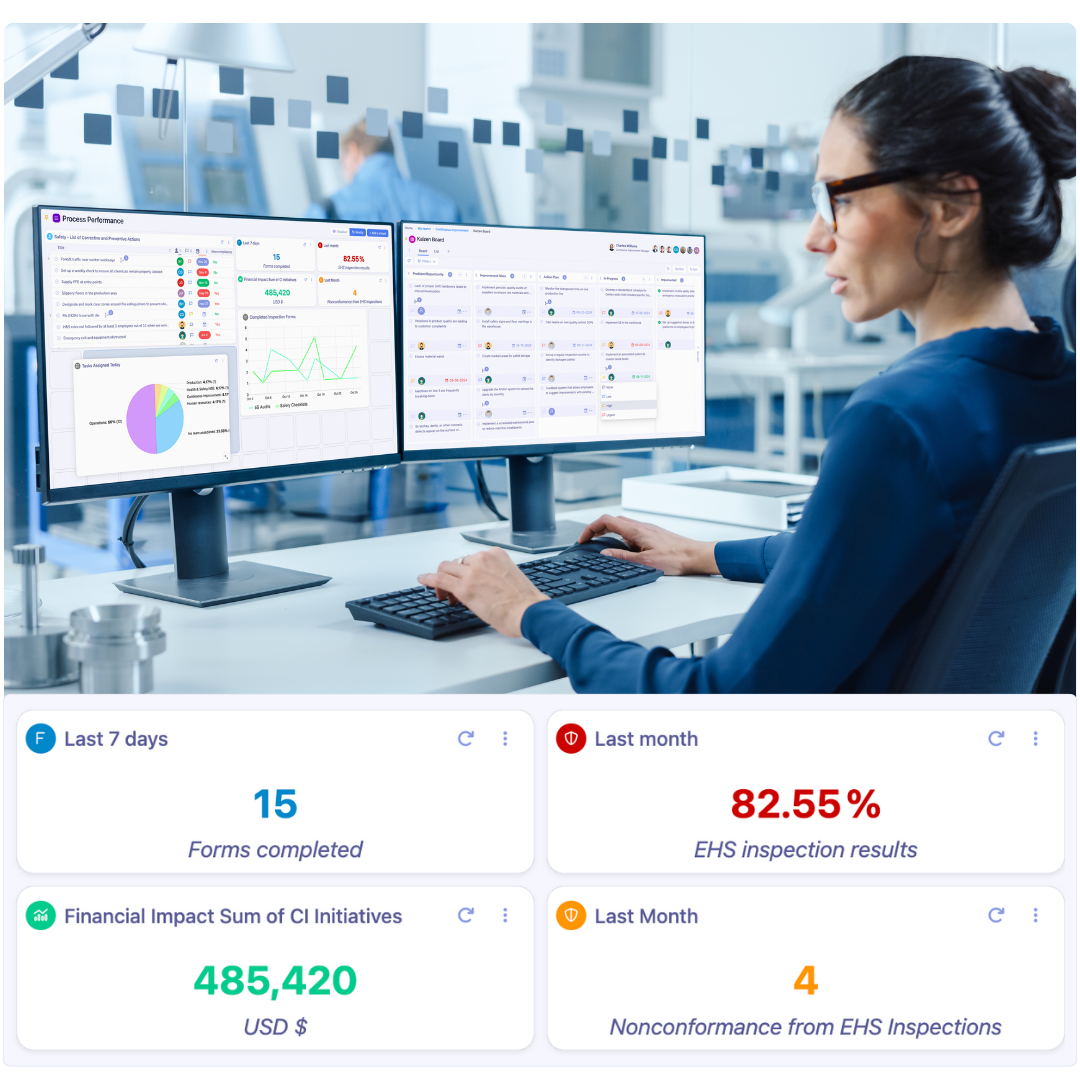
- Production tracking: By collecting data from every stage of the production process and displaying relevant KPIs, plant managers can monitor progress and proactively identify opportunities for improvement.
- Workflow management: By visualizing process flows, production teams can work more efficiently, streamline operations, and eliminate bottlenecks before they impact production schedules.
- Standardization: Visual dashboards and readily accessible guidelines can help production managers better enforce company standards and policies to enhance quality control and assurance.
- Safety management: By incorporating safety visuals, production managers can reduce the risk of workplace injuries. Tracking safety-related KPIs can streamline audits and inspections to ensure all safety standards are being met.
- Team communication: Visual aids can convey important information quickly, especially in busy and noisy production environments, when integrated with Andon systems and mobile devices like smartphones.
- Waste reduction: More efficient production flows naturally mean reduced waste, but by integrating Visual Management with your inventory and warehousing systems, you can reduce waste and keep costs to a minimum.
Industry leaders leverage Tervene to gain visibility

How does Visual Management work?
Today’s Visual Management systems are digitized, making them far more sophisticated than the paper-based techniques of old. Among the core components are digital dashboards, which provide real-time displays of key performance indicators (KPIs) and visualize data in an intuitive way. This allows workers to make data-driven decisions to boost efficiency and reduce waste.
In modern manufacturing, this data comes from various sources, including manual input from workers and internet-connected sensors monitoring machines and environmental variables.
Kanban boards are another key component of Visual Management. Nowadays, they’re almost always digitized and displayed on large screens and mobile devices. These boards include columns representing different stages of work, cards detailing specific tasks, and automation rules for task progression. Kanban boards are often integrated with visual control systems like Andon alert lights and digital signage indicating process status.
Visual Management systems need not be restricted to the shop floor. Since they’re a valuable data source for manufacturing enterprises, they can integrate with business intelligence (BI) and project management tools. This allows process engineers, production managers, and operations leaders to constantly monitor production efficiency to map and improve processes in the pursuit of continuous improvement.
6 principles of Visual Management
Visual Management is designed to create clarity, transparency, and efficiency in operations by making critical information accessible and understandable to everyone. These principles guide the implementation and use of visual tools, particularly in manufacturing and healthcare.
1. Visibility
The core of Visual Management is making essential information readily visible. Data, processes, and performance metrics should be displayed in a way that’s easy to see and understand at a glance.
2. Standardization
Consistency is critical. Use standardized colors, symbols, and formats across the workplace so everyone interprets visual cues similarly. Standardization reduces confusion and makes it easier for new team members to understand the system.
3. Clarity and Simplicity
Visual Management should simplify complex information. Whether it’s a performance metric or a safety instruction, the visual representation must be clear, concise, and easy to understand. Overcomplicating visuals defeats their purpose.
4. Goal Alignment
Visual Management tools directly support vital organizational objectives, such as improving efficiency or enhancing quality. This alignment ensures that they’re not just displays but strategic assets driving the team toward its targets.
5. Engagement and Ownership
Effective Visual Management involves the entire team. Everyone should contribute to and benefit from visual tools. It creates a sense of ownership and accountability as they see their contributions’ impact.
6. Proactive Problem Solving
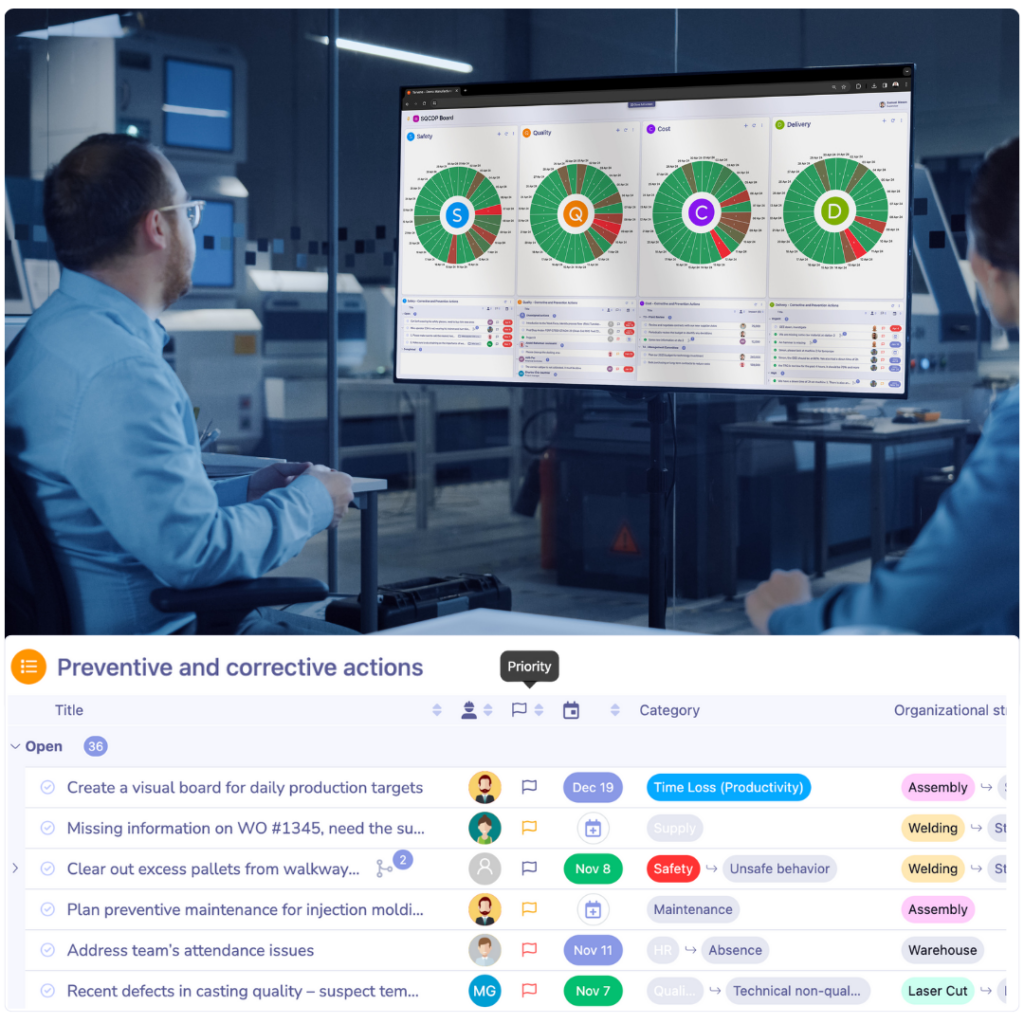
Visual Management facilitates both preventive and corrective actions. It helps identify and address issues as they arise and take steps to prevent future problems. Visual tools can track action items to ensure solutions are implemented and issues are resolved.
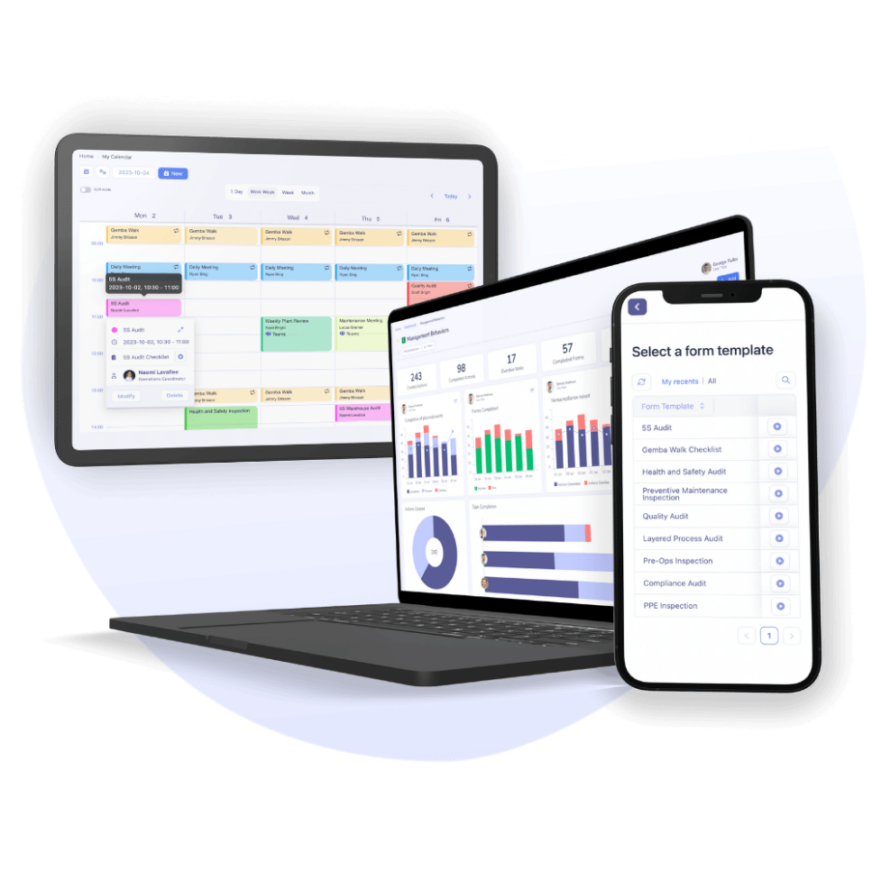
Track performance and site health metrics with Tervene’s tools


Visual Management in Lean manufacturing: the 5S method
Visual Management and the 5S method share the goal of creating an organized, efficient, and safe workplace.
Each of the 5S pillars — Sort, Set in order, Shine, Standardize, Sustain — relies heavily on visual cues to guide behaviors and maintain standards.
For example, using labels for tools, color-coded storage, and visual checklists during audits ensures that employees immediately recognize correct setups and deviations.
Visual Management reinforces 5S by making workplace organization self-explanatory and mistakes visible before they escalate.
What are the types of Visual Management tools and controls?
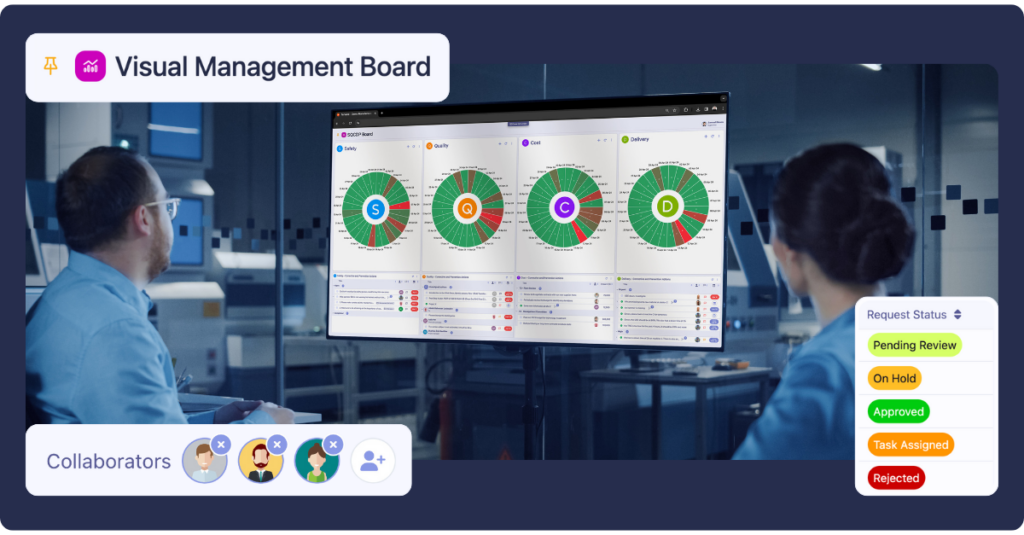
Visual Management takes various forms, each designed to streamline processes and enhance efficiency. It is often displayed on Visual Management Boards.
Performance Metrics (KPIs)
Performance metrics boards track key performance indicators (KPIs), such as production rates, quality levels, and downtime. Strategically placed in key areas, these boards offer real-time insights into team performance against set targets and empower frontline managers to make informed decisions based on data.
Production Monitoring
Production monitoring tools visually represent the status of machines, production lines, and overall output. These tools offer live updates on production performance, allow managers to identify bottlenecks, and effectively minimize downtime.
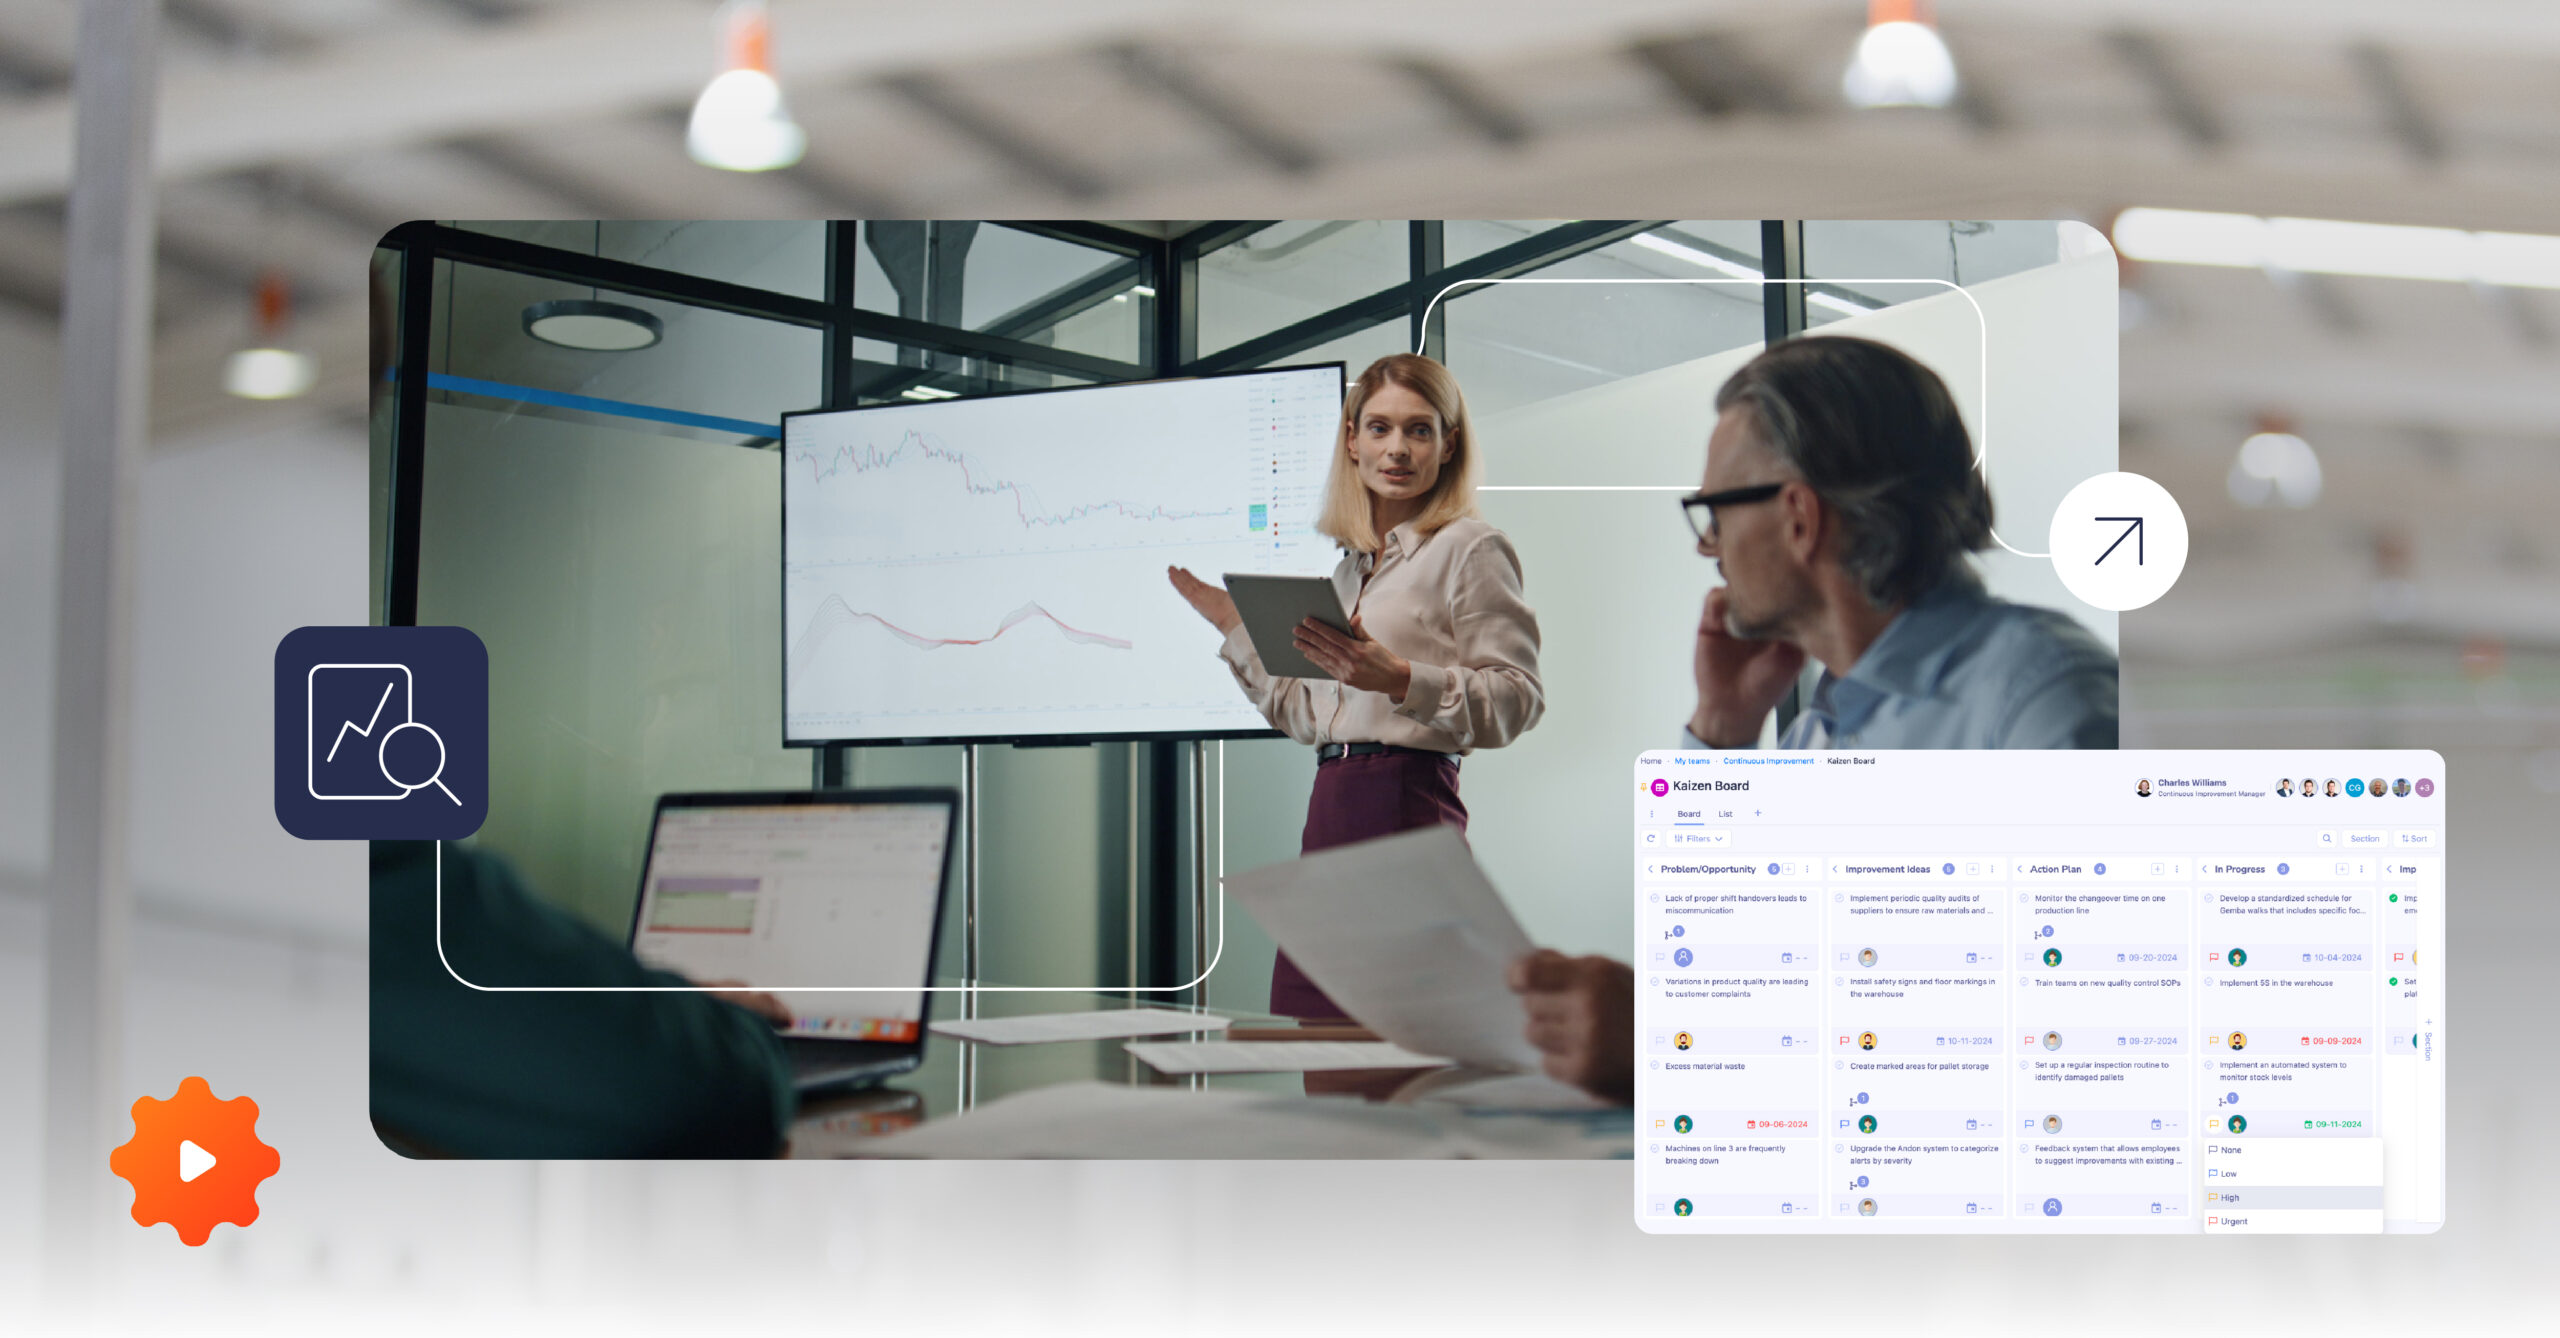
Continuous Improvement Boards
Continuous improvement boards are crucial in enabling ongoing development within teams. These boards visually display problems, root causes, and action plans related to process improvements. They promote collaboration and accountability to allow quick identification and resolution of issues.
Visual Signage
Visual signage encompasses color-coded markers, floor markings, safety signs, and other visual aids that guide workers on the shop floor. This type of Visual Management helps ensure compliance with safety regulations and assists workers in quickly locating tools.
Andon System
The Andon system utilizes visual signals, typically color-coded lights, to alert workers and managers to problems on the production line. These lights indicate the status of operations, such as green for regular operation, yellow for attention needed, and red for a problem. Andon systems empower employees to stop production when issues arise and promptly address problems.
Daily Management
Daily management boards are employed in stand-up meetings to review daily goals, performance, and any arising issues. These boards typically display key metrics, action items, and other vital information relevant to daily operations. They help teams stay focused on short-term objectives.
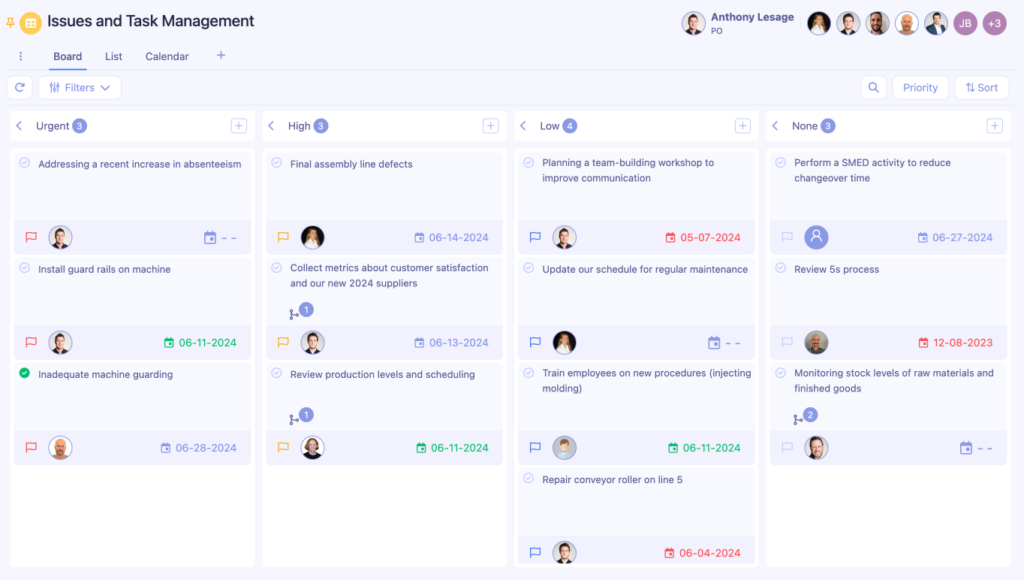
Kanban Boards
Kanban boards visually depict the flow of work through different stages of production. They show what work needs to be done, what is currently in progress, and what has been completed. Kanban boards aid teams in prioritizing tasks and maintaining efficient workflow management.
Practical Visual Management examples for projects and workflows
Manufacturing plants have significantly enhanced their operations through effective visual solutions. For instance, the implementation of color-coded workstation layouts and digital process confirmation boards has been associated with notable reductions in assembly errors. These visual tools guide workers through each step with clear indicators, ensuring consistency and quality in the assembly process.
In warehouse environments, the strategic use of floor markings and traffic light systems has been instrumental in improving material flow and safety. Clear visual cues help in organizing workspaces, directing traffic, and highlighting hazards, which collectively contribute to enhanced efficiency and reduced incidents.
Food processing facilities have also benefited from visual management tools like shadow boards and visual standard work displays. These tools streamline the changeover process by organizing equipment and standardizing procedures, leading to reduced setup times and improved accuracy.
Best Practices for Effective Visual Management
Follow a few best practices to ensure that visuals stay relevant, actionable, and aligned with operational goals.
- Start with clear objectives and measure results against specific performance targets to track progress.
- Position visual displays at the point of use where workers need information to perform their tasks.
- Keep visual elements simple with consistent symbols and colors across all departments for better understanding.
- Update information in real-time to maintain relevance and enable quick decision-making based on current status.
- Train all employees thoroughly on visual management systems to ensure proper usage and maximum benefits.
- Review and refresh visual tools quarterly to remove outdated information and adapt to changing needs.
- Create dedicated spaces for team input to encourage continuous feedback and system improvements.
What is the 1/3/10 rule?
The 1/3/10 rule is a practical design principle that helps create effective Visual Management tools. It sets a simple but powerful standard: anyone looking at a visual display should be able to:
- Understand in 1 second whether they are winning or losing.
- Identify in 3 seconds what exactly they are winning or losing at.
- Decide within 10 seconds what corrective action needs to be taken.
Applying the 1/3/10 rule means keeping information displays focused, uncluttered, and action-oriented.
For example, color-coded signals, simple charts, and clearly labeled areas allow teams to immediately grasp status without second-guessing. It also helps reinforce standard work by ensuring that expectations and procedures are consistently visible where tasks are performed.
The faster employees can interpret visuals, the faster they can react — reducing downtime, errors, and uncertainty on the shop floor.
How to implement Visual Management

Explore 10 Visual Management Must-Haves [eBook]
Choosing the right solution and involving stakeholders
Visual Management is enormous in its scope, which extends far beyond manufacturing to include logistics, healthcare, and more. That’s why it’s essential to choose a solution that aligns with the specific needs of your production environment.
Also, to ensure widespread adoption and minimum time to value, it’s important to get all stakeholders involved in the purchase decision from the get-go. At the very least, you’ll want to get your production and operations managers in on the decision-making process and the IT department.
Addressing challenges and overcoming resistance
Before implementing any new technology, it’s important to start by addressing the potential challenges and misconceptions. Digital transformation projects can be notoriously difficult to scale for manufacturers, especially across multiple networks of factories and complex supply chains.
Resistance to change is another common barrier to the adoption of new technology. Moreover, many factories have extremely expensive and highly specialized machines that can be difficult to integrate with newer technologies. However, the pressure to succeed is enormous, hence the need to communicate the benefits of new technologies to everyone using them. It’s vital to align your teams around a common vision that puts the fears and misconceptions to rest and encourages a culture of experimentation.
Choosing a cloud-hosted platform
Most manufacturers opt for a cloud-hosted platform to realize the full benefits of Visual Management. These are maintained and kept up to date by the software vendor, and since they’re hosted remotely, they aren’t so dependent on your hardware. In terms of hardware, you only need internet-connected devices and displays. Moreover, most solutions offer mobile access, allowing workers to access scheduling tools and process visualizations anywhere.
Ensuring a successful implementation
A successful implementation requires a strategic and consistent approach, especially in multi-site settings. In more complex manufacturing environments, it’s often best to start small, but it’s still vital that you’re fully committed to the process. Implementing new tech requires proper training and workforce development to ensure maximum adoption rates. Ideally, the solution vendor should offer training and ongoing support and guarantee maximum response times to support requests. Finally, you’ll need to regularly monitor and review your Visual Management implementation by collecting employee feedback and making necessary adjustments.

A supervisor’s day with Visual Management
Sarah, a frontline supervisor at an automotive parts plant, starts her day with a morning meeting. The daily management board shows yesterday’s KPIs. A red flag: one line had high downtime. Sarah can now prioritize addressing the root cause.
As Sarah walks the floor, the Andon light flashes red. This immediate alert prevents a potential issue from escalating. The operator uses the Andon system, and Sarah swiftly calls maintenance to avert a possible disruption.
After the Andon incident, Sarah checks the Kanban boards. A ‘trigger card’ catches her eye, signaling low stock on a part. She promptly orders more to prevent potential line delays.
Back in her office, the production monitoring shows Line 4 is slow. On the floor, the team struggles with a new process. Sarah gathers them, discusses improvements, and reassigns tasks.
Later, she checks out the continuous improvement board, a suggestion hub. An operator proposes a new tool arrangement, which Sarah adds to the board to test in the next few days.
Sarah’s day ends with a sense of achievement. Visual Management helped her identify issues, keep her team informed, and make quick adjustments.
Moving toward digital Visual Management tools
When implemented and used correctly, Visual Management quickly becomes a critical enabler of continuous improvement and an invaluable component of lean manufacturing. Equipped with visual controls and real-time data-driven insights, your organization will have what it needs to enhance efficiency, improve safety, reduce waste, and plan for the future of Industry 4.0.
Tervene helps organizations implement Visual Management and achieve operational performance with its software.
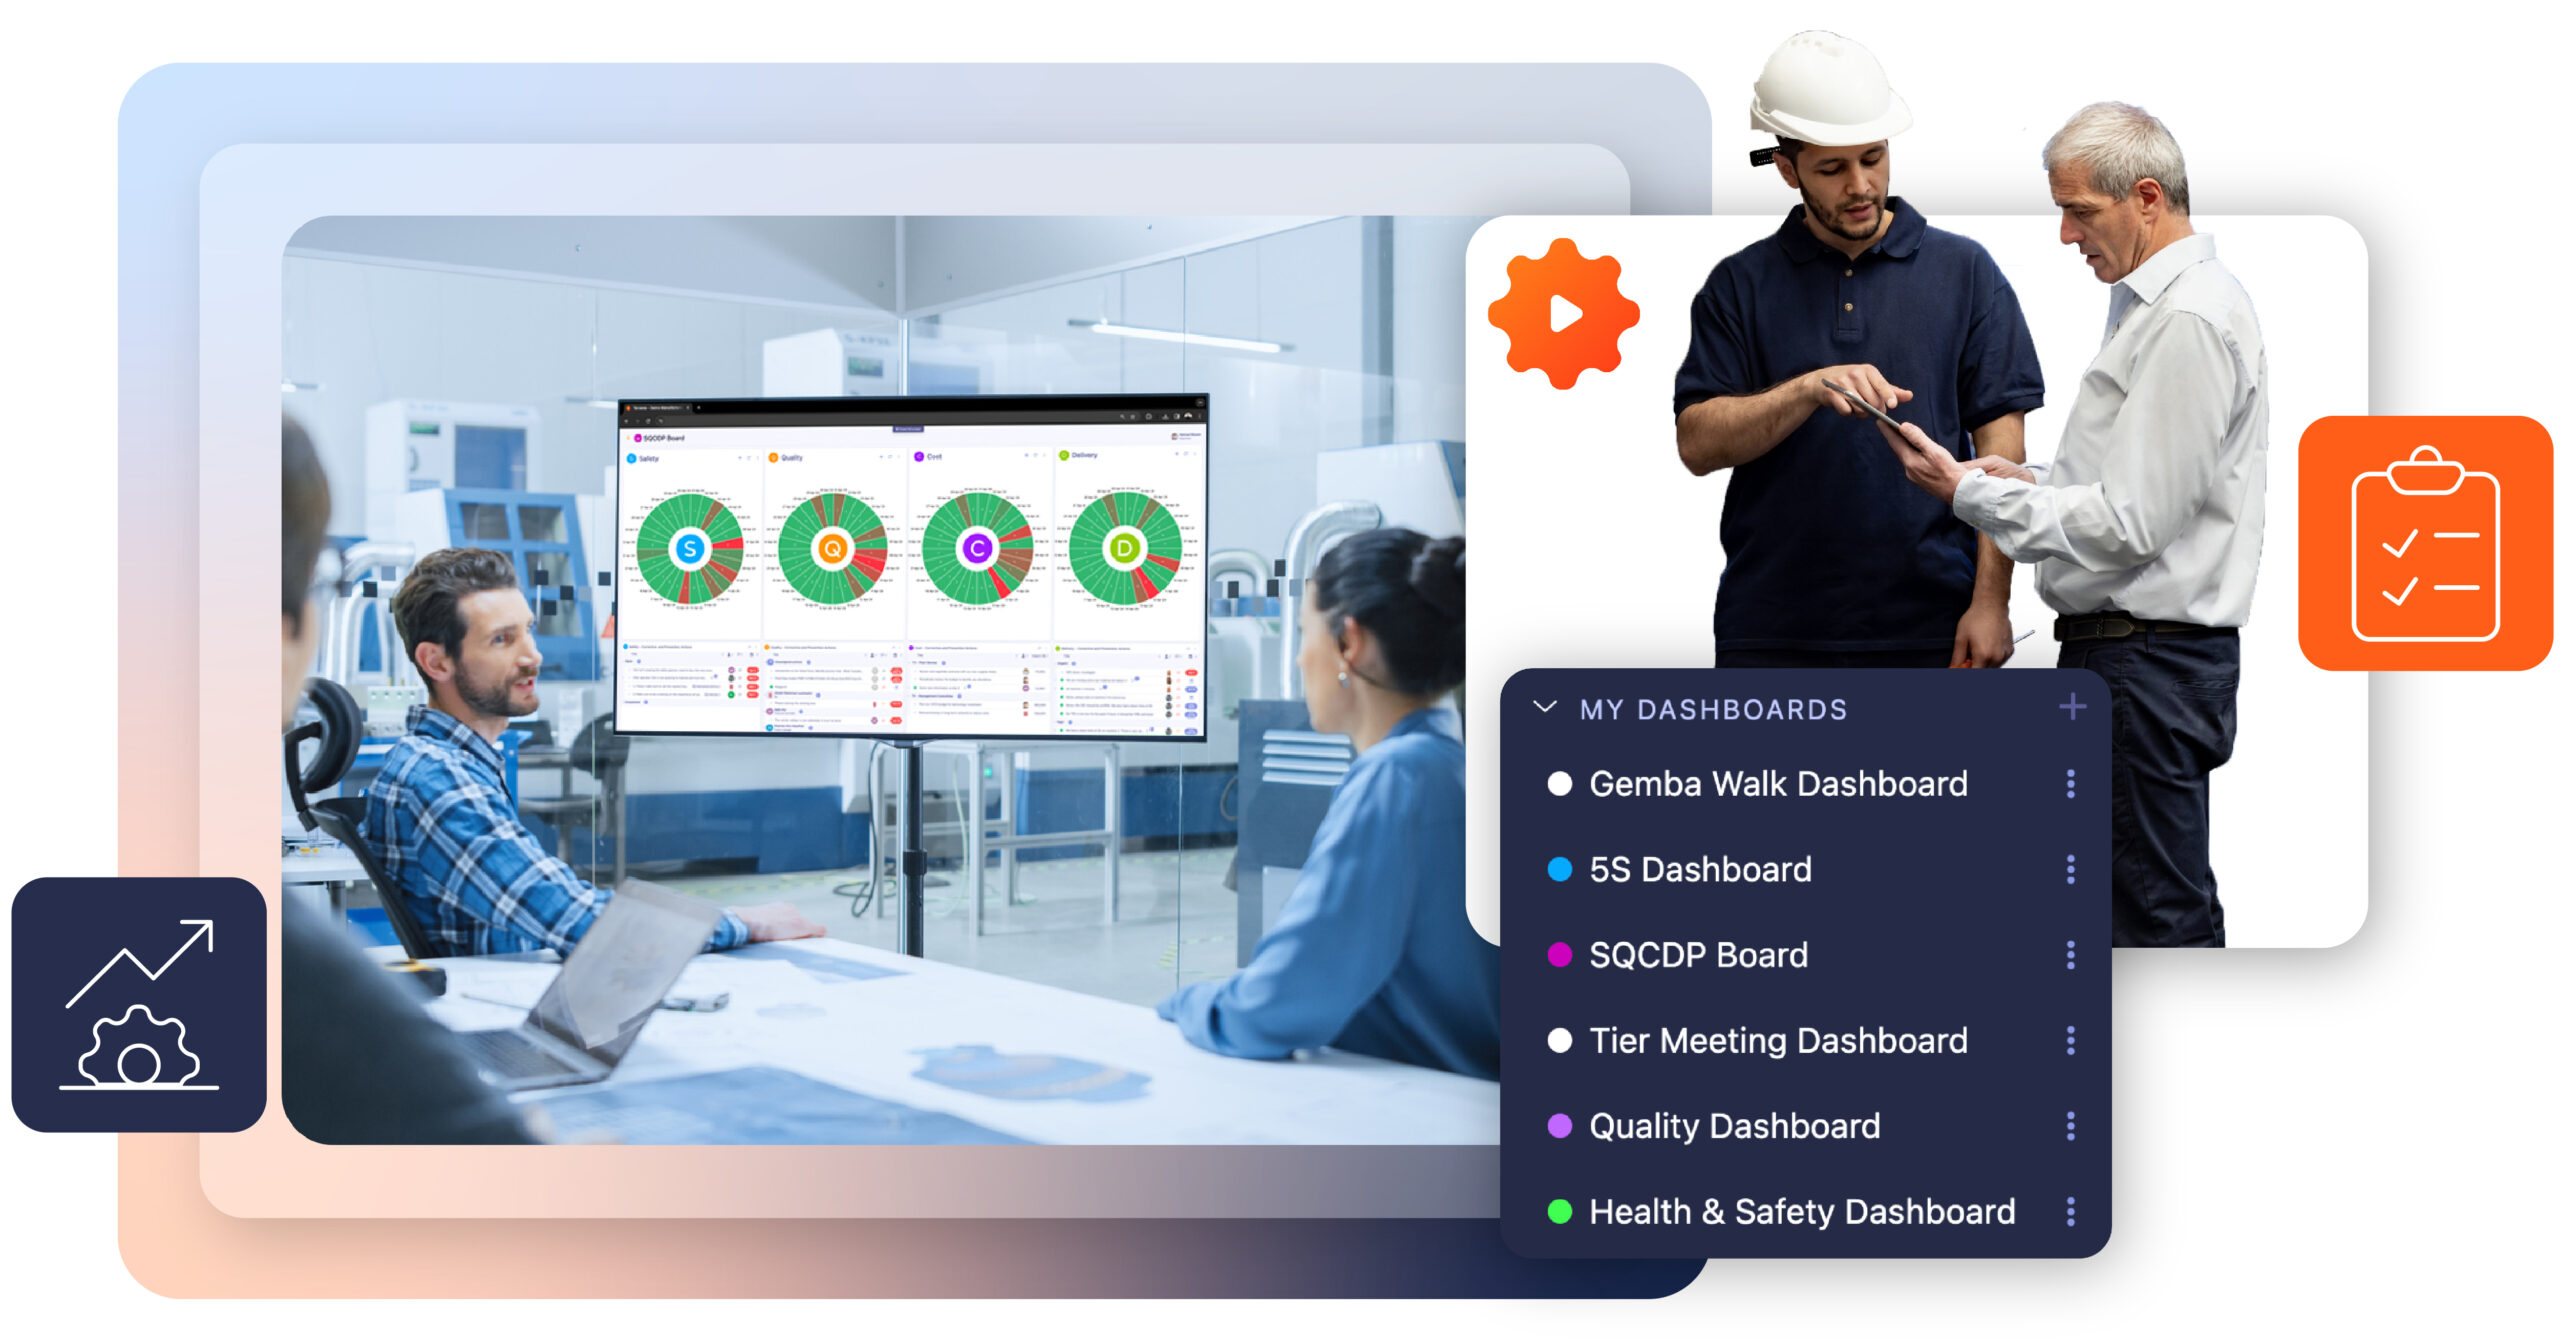
Digitize your dashboards with Tervene and gain better visibility into your operations and KPIs
- Use mobile and digital boards to share performance instantly
- Build custom dashboards to track KPIs, corrective, and preventive actions
- Keep teams aligned with standardized displays and updates
FAQ about Visual Management
Visual Management is a methodology used in production environments to improve efficiency, transparency, and communication by making information visual and easy to understand. It involves using tools like Kanban boards and digital dashboards to help workers quickly grasp the status of processes, identify issues, and make informed decisions.
A Visual Management system is a set of tools and practices used to display critical information visually in the workplace. It helps teams track performance, identify problems, and make faster decisions by making key information easy to see and understand at a glance.
Visual Management tools are methods, devices, or displays that communicate important information in a simple, visual format. Common examples include color-coded dashboards, SQCDP boards, Kanban boards, Andon lights, floor markings, and daily performance charts.
Visual Management offers numerous benefits, including:
- Optimized workflow management and elimination of bottlenecks
- Increased standardization and quality control
- Improved safety management and compliance
- Streamlined team communication and information sharing
- Reduced waste and cost savings
Modern Visual Management systems typically include:
- Digital dashboards displaying key performance indicators (KPIs)
- Data integration from various sources, including embeddable widgets and manual input
- Digital Kanban boards for task progression
- Connection to business intelligence (BI) and project management tools
Critical steps for successful implementation include:
- Choosing a solution that aligns with your specific needs and integrates with existing systems
- Involving all stakeholders in the decision-making process
- Addressing potential challenges and misconceptions
- Overcoming resistance to change and integration issues
- Opting for a cloud-hosted platform for flexibility and ease of use
- Providing proper training and workforce development
- Monitoring and reviewing your implementation regularly
The 1-3-10 rule is a design principle used in Visual Management. It means information should be presented so clearly that:
-
In 1 second, you can see if you are winning or losing.
-
In 3 seconds, you can understand what area is impacted.
-
In 10 seconds, you can decide what action needs to be taken.
Following this rule helps teams react quickly and accurately.
In Lean manufacturing, Visual Management supports continuous improvement by making problems, progress, and standards visible. It empowers teams to monitor operations in real time, spot deviations early, and correct issues before they grow, ultimately driving efficiency and reducing waste.
Tervene provides a digital Visual Management solution that helps organizations achieve operational control and excellence. Our software enables data visualization, streamlined workflows, and continuous improvement to enhance efficiency, safety, and productivity.
To learn more about how Tervene can help your operations, book a demo.