


Ishikawa diagram: how to use the Fishbone for root cause analysis
| Audience: | Directors and VPs of Operations, Plant and Operations Managers, Continuous Improvement Managers, Quality Managers, Six Sigma and Lean Practitioners, Manufacturing Engineers, Supervisors and Team Leads |
| Last updated: | July 3, 2026 |
| Read time: | 7 min |


- The 6M framework (Man, Machine, Material, Method, Measurement, Milieu) gives teams a structured way to brainstorm causes without skipping an entire category of the problem.
- Building one follows a set sequence: state the problem, add the 6M branches, brainstorm causes with a cross-functional group, then validate with data before prioritizing.
- The fishbone surfaces candidate causes; the 5 Whys then drills into the top two or three to confirm which one is the actual root cause.
What is the Ishikawa cause-and-effect diagram? Definition and purpose
An Ishikawa diagram is a visual root cause analysis method that organizes a problem’s potential causes into structured categories branching from a central spine.
The term “fishbone” refers to the diagram’s shape, which resembles a fish skeleton with ribs extending from a backbone. “Ishikawa” is the formal name, honouring its creator, Kaoru Ishikawa. Both terms describe the same tool and are used interchangeably across industries. You’ll also hear it called a herringbone diagram or a cause-and-effect diagram.
The effect diagram format makes it easy to see relationships between causes and the overall issue, which helps prioritize where to dig deeper. It’s especially useful when a problem has multiple contributing factors or requires cross-functional input.
Manufacturers trust Tervene to track every root cause to resolution

Origin of the Ishikawa method
Kaoru Ishikawa developed the fishbone diagram in the 1960s while working on quality management initiatives at Kawasaki shipyards in Japan. His goal was to give frontline teams a simple, visual way to organize brainstorming and move from symptoms to root causes, without requiring advanced statistical training.
The diagram quickly became one of the seven basic tools of quality. Since then, the Ishikawa diagram has been adopted widely in Lean, Six Sigma, and continuous improvement programs.
The 6M categories of the Fishbone diagram explained
The 6M framework is the standard set of categories used in manufacturing to organize potential causes in an Ishikawa diagram. These six categories give teams a structured way to brainstorm without missing important areas. The 6Ms stand for Man (or Manpower), Machine, Material, Method, Measurement, and Milieu (Environment).
Ishikawa introduced these categories to help teams think systematically, but he also encouraged adapting the names to fit specific contexts. Some teams swap “Man” for “People” or add categories like Management. Others drop ones that don’t apply. The goal is to make the framework useful for your shop floor.
Here’s how the 6M categories break down in practice, using the example of increased defect rates on a batch production line:
6M categories overview table: meaning and examples
| Category | What It Covers | Manufacturing Example |
|---|---|---|
| Man/Manpower | Skills, training, staffing levels, shift coverage, operator experience | Operator skill gaps leading to assembly errors or missed quality checks during setup |
| Machine | Equipment condition, tooling, maintenance schedules, calibration, downtime | Inconsistent calibration on the press is causing dimensional drift in stamped parts |
| Material | Input quality, supplier performance, lot-to-lot variance, handling, storage | Supplier variance in raw material grade results in inconsistent part strength |
| Method | Work instructions, procedures, standard work, process design, setup steps | Unclear standard operating procedures are causing operators to skip inspection steps |
| Measurement | Gauges, data collection, sampling methods, calibration, and inspection frequency | Misread gauges on the inspection station due to worn markings or incorrect units |
| Milieu/Environment | Workspace layout, lighting, temperature, humidity, noise, cleanliness | Cramped workspace causing material mix-ups or incorrect part placement during assembly |
When you sit down with a cross-functional team, each 6M category brings up specific questions. You’re asking, “What about the machines could cause this?” or “Is there a measurement issue here?”
That structure makes root cause analysis faster and more thorough.
How to create an Ishikawa or Fishbone diagram: steps, template, and checklist
To build a fishbone diagram, you need to work through each step deliberately with your cross-functional team.
Step 1: Write a clear problem statement at the head of the diagram
Start with one focused problem. For example: “Defect rate increased 12% on the batch line over the last 30 days.”
Step 2: Draw a horizontal line (the spine) with the problem at the right end
Sketch a long horizontal arrow pointing right. Place your problem statement at the arrowhead.
Step 3: Add the 6M categories as main branches angling off the spine
Draw six diagonal lines branching off the spine, three above and three below. Label each with one of the 6Ms: Manpower, Machine, Material, Method, Measurement, Milieu.
Step 4: Brainstorm possible causes under each branch with your cross-functional group
Gather operators, supervisors, quality staff, and maintenance. Ask each group to suggest causes under their relevant category. Write every idea on the diagram without filtering.
Step 5: Collect data to validate or rule out each suspected cause
Go to the line and check the facts. Review inspection logs, calibration records, training rosters, and supplier documentation. This data confirms or eliminates guesses.
Step 6: Prioritize the most likely root causes for deeper investigation
Narrow your list to the top two or three causes backed by evidence. For the batch line, that might be operator skill gaps, calibration drift, and supplier variance.
Step 7: Apply the 5 Whys to drill into top candidates
For each prioritized cause, ask why it happened, then why again, until you reach a fundamental root cause you can fix, following the same logic as the 5 Whys method.
Step 8: Assign countermeasures tied to verified root causes and plan follow-up checks
Define specific actions, owners, and due dates. Schedule verification audits to confirm that the countermeasures are working.
A facilitator should guide the session to keep the team focused and prevent premature conclusions. The diagram should be built with people from different functions present to capture the full picture of what’s happening on the floor.
Reference checklist
- Define the problem statement clearly
- Draw the spine and place the problem at the right end
- Add the 6M categories as main branches
- Brainstorm causes with cross-functional input
- Collect data to validate suspected causes
- Prioritize the most likely root causes
- Apply 5 Whys to drill deeper
- Assign countermeasures with owners and follow-up dates
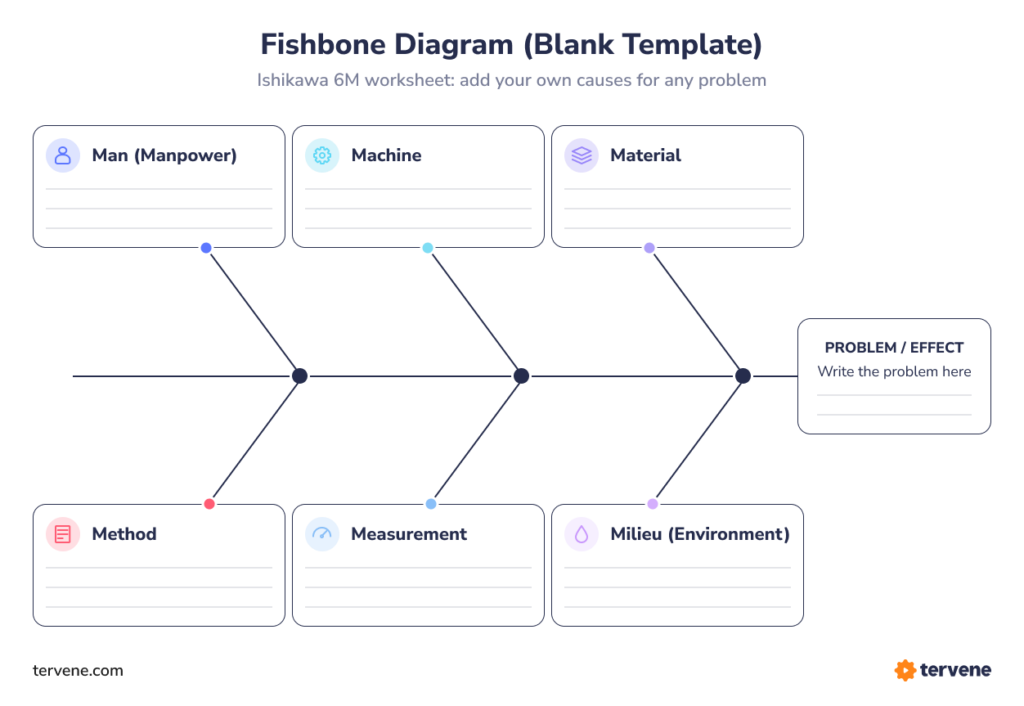
Ishikawa Fishbone diagram blank template
Explore Tervene’s problem-solving and other relevant tools


Ishikawa diagram examples for manufacturing problem-solving
You’ll reach for an Ishikawa diagram when you’re facing recurring quality issues, fielding customer complaints, investigating a specific event with multiple potential factors, or dealing with any problem where the root cause isn’t obvious.
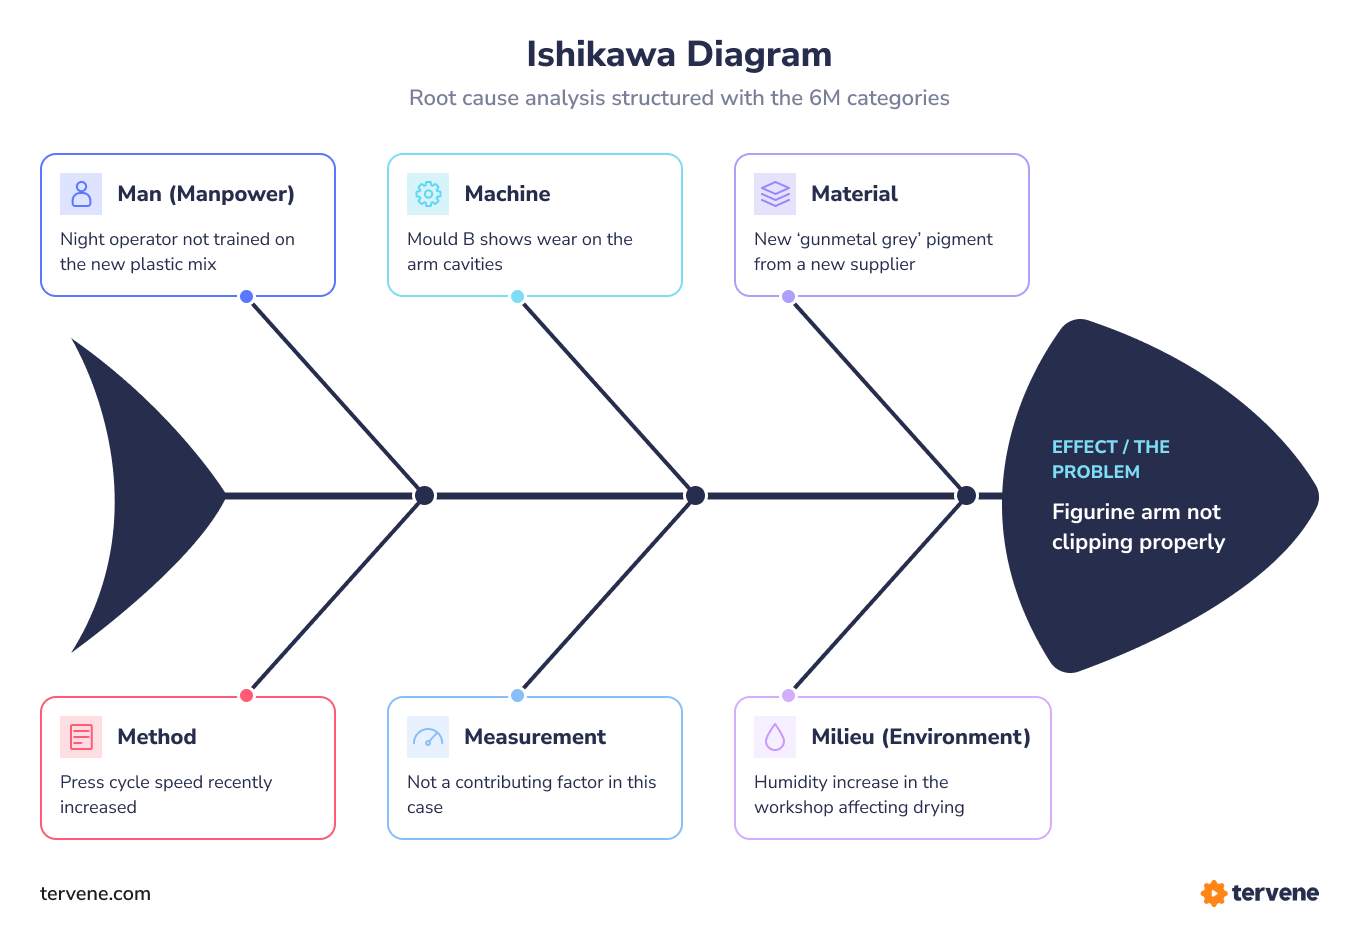
Take the batch-line defect example we’ve followed through this guide. The team built the fishbone and identified three verified root causes: operator training gaps (Manpower), inconsistent calibration on the press (Machine), and supplier variance in raw material grade (Material). The resulting countermeasures addressed each verified cause directly: a refreshed training module, daily calibration checks with a digital log, and tightened supplier specifications with incoming inspection sampling.
The diagram’s versatility extends beyond manufacturing. Service industries use it to investigate delivery delays, and healthcare teams apply it to patient safety incidents.
It pairs well with A3 problem-solving for documenting the full investigation and with a Gemba Walk for on-site observation. When you combine the fishbone’s structure with real-time data from the floor, you get a complete picture of the problem.
What is the connection between the Ishikawa diagram and the 5 Whys?
The fishbone diagram surfaces potential causes, while the 5 Whys technique peels back layers of each candidate to confirm the root cause. Build the fishbone first, then apply 5 Whys to the top two or three branches.
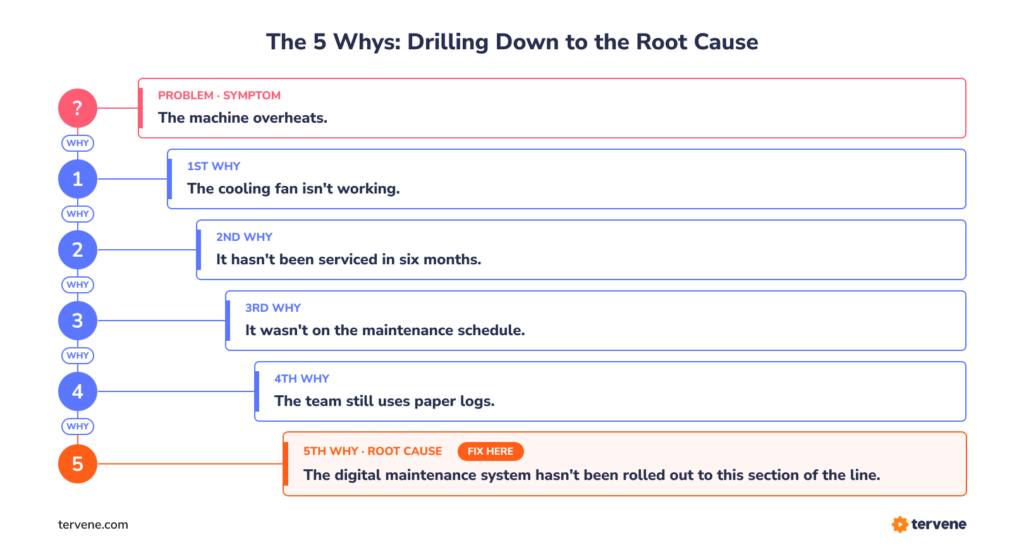
This two-step approach keeps brainstorming broad at the start and focused later. Firstly, the fishbone organizes the problem space. Secondly, the 5 Whys drills into verified root causes. Both tools work better when cross-functional teams participate, and data backs every claim.
Tracking Ishikawa diagram results with Tervene
Digitalize your Fishbone actions with our software
Once you’ve identified root causes and assigned countermeasures, the next challenge is follow-through. A fishbone session produces clear findings, but without structured tracking, the same issues will recur.
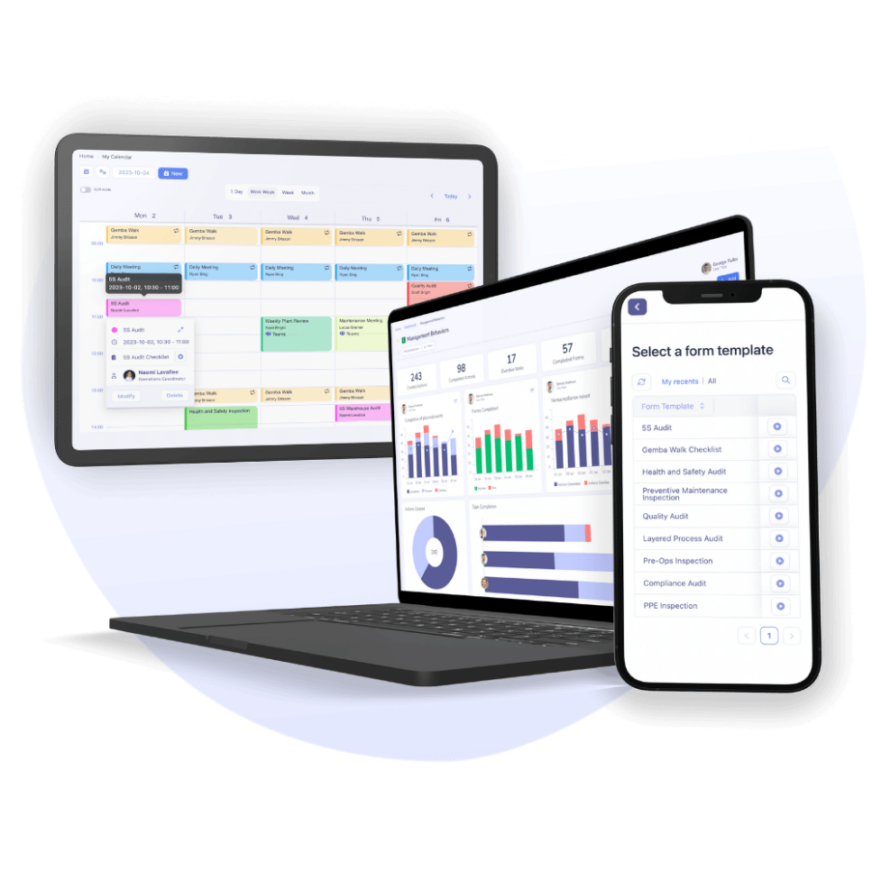
Tervene is a daily management and operational excellence software that helps teams document issues, track actions, assign ownership, and monitor results following an Ishikawa session.
Turn your Ishikawa diagram into tracked corrective actions
- Build Ishikawa diagrams on the floor using pre-built Fishbone templates and 6M category prompts
- Assign corrective and preventive actions with clear owners, due dates, and real-time tracking
- Trace every root cause from the Fishbone diagram to verified resolution so nothing falls through the cracks
FAQ: Ishikawa diagram and Fishbone diagram
The Ishikawa diagram, also called a fishbone, cause-and-effect, or herringbone diagram, is named for its shape, which resembles a fish skeleton. It was developed by Kaoru Ishikawa in the 1960s and used for root cause analysis. These terms are interchangeable in quality management.
The fishbone diagram is widely used in Six Sigma, especially in the Analyze phase of DMAIC, to identify causes of variation before statistical analysis. It is also used in Lean, TQM, and continuous improvement. Pre-dating Six Sigma by decades, it is one of the seven basic quality tools in the broader quality toolbox.
The original 5M model includes Man (or Manpower), Machine, Material, Method, and Measurement. Kaoru Ishikawa introduced these five categories to structure root cause investigations in manufacturing environments. Later, practitioners added a sixth M, Milieu (or Environment), to capture factors like workspace layout, temperature, lighting, and other conditions that affect processes. Today, the 6M framework is standard in modern manufacturing, though some teams still reference the 5M model when discussing the tool’s origins or when the environment category isn’t relevant to their problem.
The 5P variant, Product, Price, Place, Promotion, and People, comes from marketing and service industries, not manufacturing. This framework adapts the fishbone structure to analyze problems related to the marketing mix or service delivery. For example, a retail team investigating declining sales might use the 5Ps to organize potential causes. It’s a useful adaptation, but it differs fundamentally from the 6M framework used on the shop floor. If you’re working in manufacturing or operations, stick with the 6Ms; if you’re in service industries or marketing, the 5Ps may fit better.
Some organizations add a seventh category to the standard 6Ms, often Management or Mother Nature. Management covers leadership decisions, policy changes, or resource allocation that might contribute to a problem. Mother Nature encompasses external factors such as weather and natural events. The key point is that the framework should be adapted to fit your specific situation. Ishikawa himself encouraged teams to modify category names and add branches as needed, so a seven-category diagram is perfectly valid if it helps your investigation.
Build a fishbone diagram in Word or PowerPoint with shape tools. Insert a horizontal line for the spine, then add branches for categories. Label with text boxes and list causes. Basic tools suffice for brainstorming, but Visio or Lucidchart offer more features.
Healthcare teams use fishbone diagrams to investigate incidents, delays, errors, and gaps, adapting categories such as People, Process, Equipment, Environment, and Policy to the healthcare context. For instance, examining ER wait times might involve causes such as staffing, triage, equipment, and flow. Its flexibility makes it useful beyond manufacturing.
Project managers use Ishikawa diagrams to identify risk factors and potential failure points during planning or post-mortem reviews. For example, if a project misses a deadline, the team can create a fishbone diagram to analyze causes across categories such as Resources, Communication, Scope, Schedule, and People. It’s useful during risk planning to anticipate issues before work begins. The diagram organizes brainstorming and helps teams see patterns they might miss in a list.