



















Expert articles


Problem Solving and Continuous Improvement
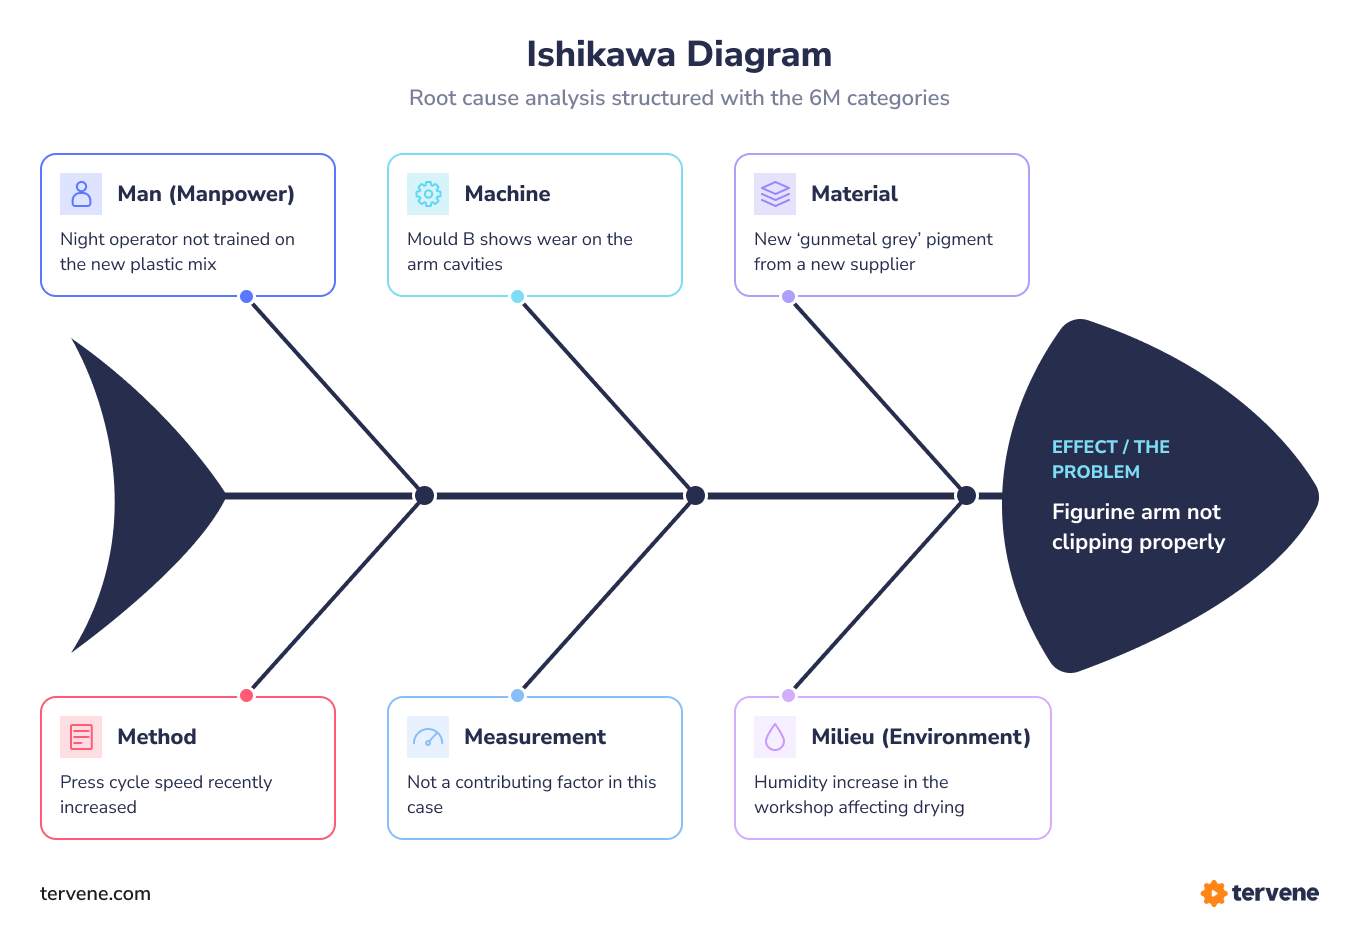
Ishikawa diagram: how to use the Fishbone for root cause analysis

Charles-Olivier Bisson
An Ishikawa (Fishbone) diagram sorts causes into the 6M categories, so you can identify the root cause. Build steps, template, and checklist.

The 5 Whys Method: Root Cause Analysis for Operations Teams
Charles-Olivier Bisson
The 5 Whys method drills past symptoms to the cause of a problem. Step-by-step guide with examples and a template for your team.

Hoshin Kanri: Lean Planning Method to Align Goals and Daily Tasks

Jean-Philippe Metivier
Learn what Hoshin Kanri is, the Lean planning method that aligns long-term goals with daily execution (benefits and step-by-step process).
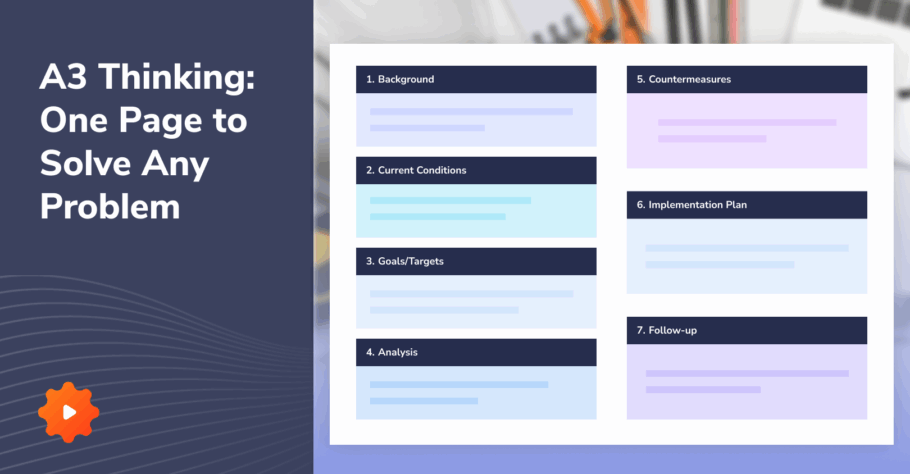
A3 Problem-Solving: A Step-by-Step Guide for 2026
Jean-Philippe Metivier
Learn how A3 problem-solving helps you fix recurring issues by tackling root causes. Follow each step with tools and real-world tips.
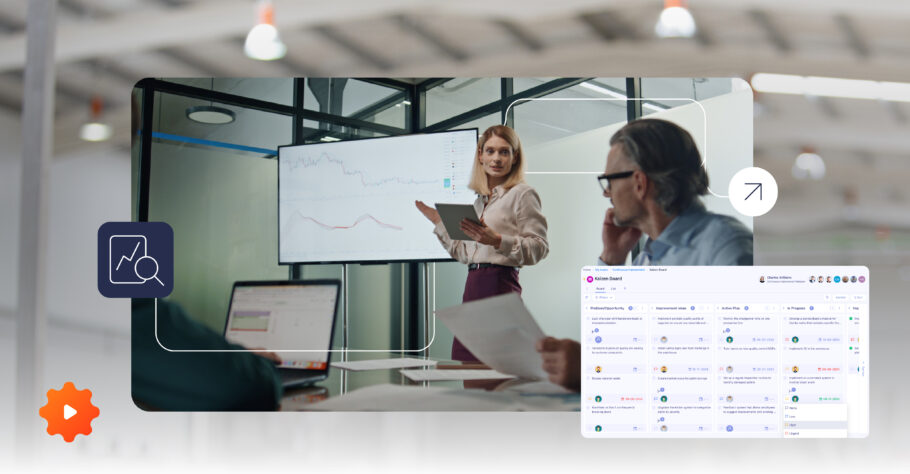
Kaizen Boards: Continuous Improvement Meets Visual Management
Jean-Philippe Metivier
Discover how Kaizen boards drive operational excellence. Learn the setup steps, key differences from Kanban, and the benefits.
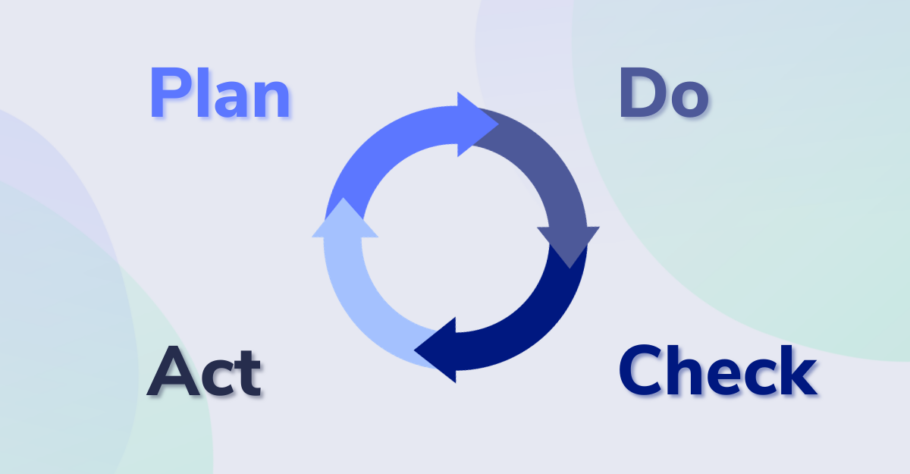
What Is the PDCA Cycle (Plan Do Check Act Methodology)?
Jean-Philippe Metivier
Discover the PDCA cycle framework, steps, examples, and free templates to drive continuous improvement in any industry.
8 Steps to Develop a Continuous Improvement (Kaizen) Culture for Plant Operations
Jean-Philippe Metivier
To optimize your plant's performance, rely on continuous improvement or Kaizen. Here are 8 best practices to follow!

What Is a Quick Response Quality Control (QRQC) System?
Charles-Olivier Bisson
The QRQC system is a standardized approach to problem-solving, enabling cross-functional teams to resolve quality issues quickly.

How to overcome workforce challenges in manufacturing ?

Morgane Lança
Having workforce challenges? Discover digital tools that help tackle some of the most common workforce challenges in manufacturing!

How to Shift From Firefighting Mode to Proactive Management

Anthony Lebel
Gain control over your operations through proactive management and limited firefighting mode. Causes of a reactive type of management

Continuous Improvement with Tervene’s App
Charles-Olivier Bisson
Identify improvement opportunities. Prioritize improvement ideas. Manage action plans with Tervene's App.

How Gemba Walks Sustain a Strong Continuous Improvement Culture in Factories
Charles-Olivier Bisson
A Gemba Walk is a proactive problem-solving practice that enhances operational control and continuous improvement in factories.

Essential Features of a Continuous Improvement Software

Samuel Bisson
Best continuous improvement software. Real time visibility on improvement efforts. Accountability of managers towards improvement. Increased effectiveness of managers. Increased worker engagement towards company objectives.