


Cost of Inaction in Manufacturing: Calculate Hidden Losses
| Audience: | Manufacturing Managers, Healthcare Administrators, Operational Excellence and Lean Management Practitioners, HR Coordinators, Organizational Leaders |
| Last updated: | March 23, 2026 |
| Read time: | 12 min |

- Globally, inaction costs around 15 points of GDP, compared to just 1.2 points for investment in the transition.
- The status quo results in up to 800 hours of unplanned downtime per year for an average manufacturer and a steady erosion of productivity.
- Measuring indicators like downtime, cost of poor quality, and performance gaps helps quantify and reduce these losses.

Not acting is a decision in itself. Inaction creates hidden costs that impact operational excellence and slow progress toward your long-term competitiveness goals. According to an IDC study, unaddressed internal inefficiencies account for between 20% and 30% of companies’ annual revenue. This phenomenon, often invisible on traditional dashboards, poses a major risk to the profitability and sustainability of production sites.
This article details the mechanisms by which the cost of inaction affects industrial companies, quantifies its real impact, and presents concrete solutions to turn delayed decisions into opportunities for continuous improvement and problem-solving.
What is the cost of inaction (COI) in industrial companies?
Definition of the cost of inaction
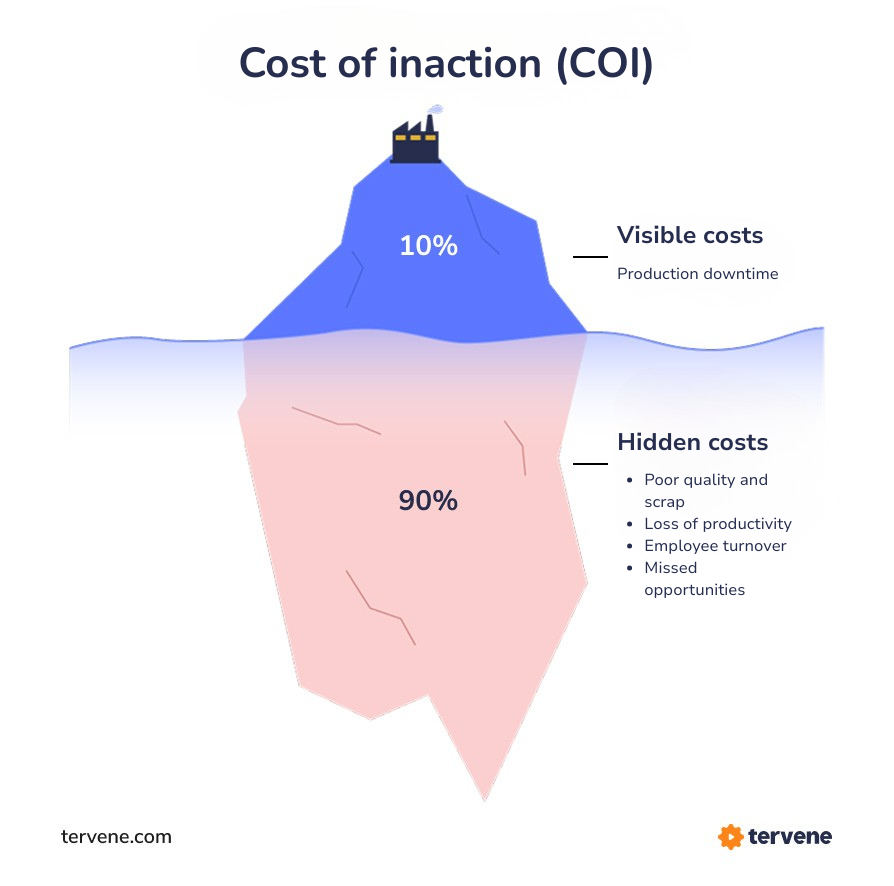
The cost of inaction (COI) includes financial, operational, human, and strategic losses that occur when a company stays with the status quo despite identified problems or opportunities for improvement.
In industry, it far exceeds visible costs: Measuring COI allows for quantifying the true impact of inaction and justifies investments in optimization, continuous improvement, or digital transformation.
- time spent managing errors or circumventing malfunctions
- slowdowns or delays in production
- quality or safety risks that are not addressed
- loss of competitiveness compared to more responsive players
- impact on reputation and customer satisfaction
The hidden dimensions of the cost of inaction
While COI is hard to notice in traditional financial statements, it still appears daily in the workshop.
- Loss of productivity caused by non-standardized or obsolete processes
- Opportunities for continuous improvement are overlooked due to a lack of pace or visibility
- Erosion of competitiveness in the face of competitors who optimize more quickly
- Demotivation and frustration among teams, repeating the same corrections
- Hidden extra costs: micro-stops, waste, defects, double handling, etc.
Manufacturers avoid the cost of inaction and safeguard their profitability with Tervene

What is the opportunity cost of inaction in business?
The opportunity cost of inaction is the profit an industrial company loses by sticking to the status quo instead of investing in process improvements.
What are the economic impacts of inaction?
In practical terms, every day a factory delays implementing optimization solutions results in lost potential gains, such as higher productivity, reduced waste, improved quality, and greater competitiveness.
For example, a company that delays adopting predictive maintenance tools misses out on direct savings from fewer breakdowns, as well as indirect benefits such as increased customer satisfaction and the opportunity to reallocate resources to higher-value activities.
Over time, the gap widens as competitors accelerate, maintenance costs rise, and the organization loses its capacity to seize new opportunities.
Measure and reduce your cost of inaction with Tervene’s tools


How does inaction manifest itself in a factory?
Inaction manifests in a series of behaviours and situations. It can be identified when:
- Decisions are often delayed. Factory managers recognize that equipment requires predictive maintenance, but instead of adopting a TPM approach, they wait until a complete breakdown occurs before acting. Production managers pinpoint bottlenecks but do not perform thorough analysis. This “wait and see” attitude causes delays and raises the cost of emergency repairs.
- Processes stay stuck despite their inefficiency. The well-known “we’ve always done it this way” dominates conversations. Outdated operating procedures continue even though proven solutions are available. This resistance to change, driven by fear of the unknown or a lack of time and budget for transformation, keeps the organization in a costly comfort zone.
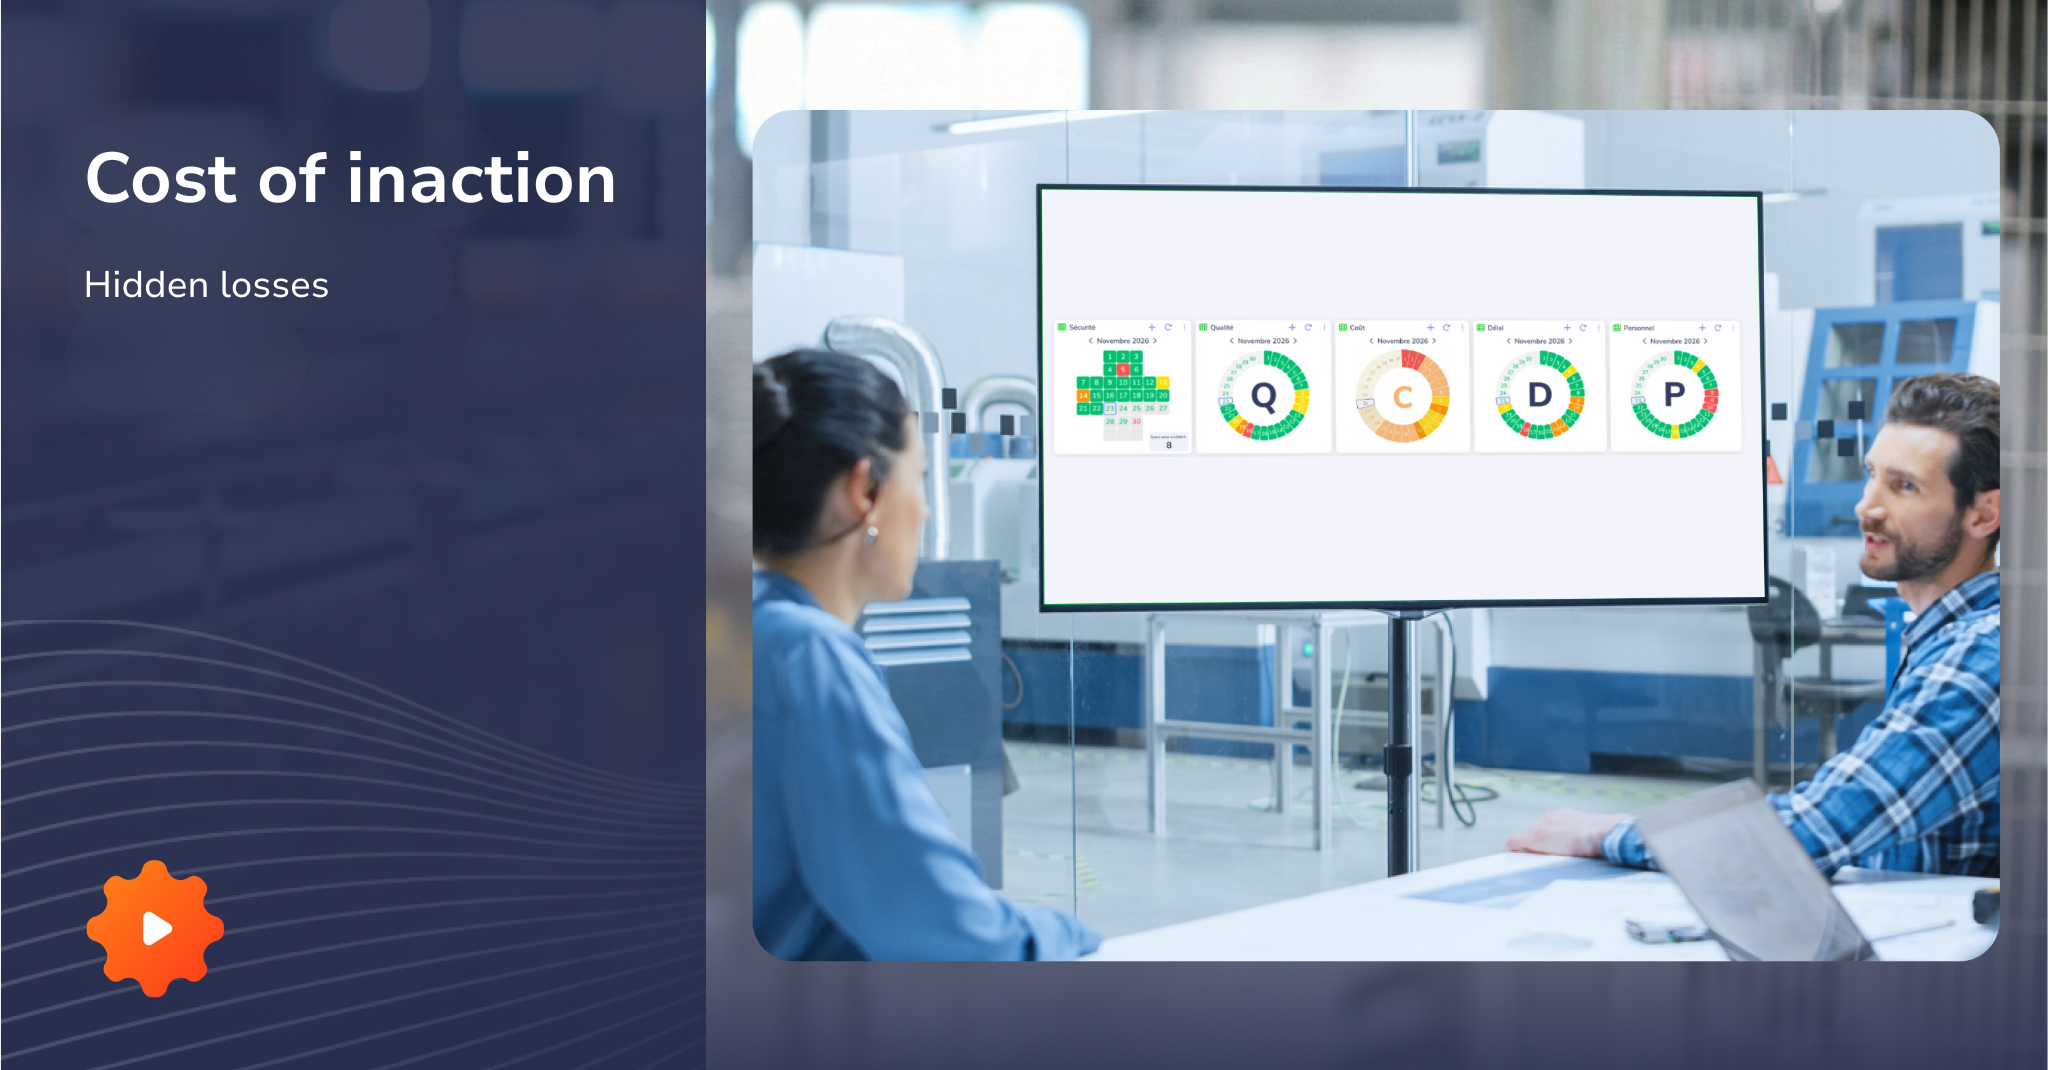
- Management tools are not fully utilized. Production data builds up without being examined. SQCDP (Safety, Quality, Cost, Delivery, Personnel) indicators are on paper but do not result in any corrective actions. The absence of digital lean management tools and visual management prevents teams from having a clear view of priorities and issues.
- Continuous improvement is seen as a constraint. Kaizen projects and other lean management efforts are viewed as additional burdens rather than profitable investments. Resources are scarce, time is limited, and, ultimately, progress stalls while losses mount.
How much does inaction really cost industrial companies?
The financial impact of inaction in the industrial sector is significant, affecting multiple aspects of performance. Unplanned production stoppages are the most obvious cost, but inefficiency goes beyond equipment issues: skill gaps, errors from non-standardized processes, and staff turnover also lead to major losses. These costs, often spread across various budget items, are not always recognized by company management, which sustains inaction.
Six key figures:
- $1.5 trillion in cumulative annual losses for Fortune Global 500 companies due to unplanned downtime, representing 11% of their total revenue (Siemens “True Cost of Downtime 2022”)
- 800 hours per year of average unplanned equipment downtime for a manufacturer, representing more than 15 hours per week during which teams are paid but do not produce (TeamSense analysis)
- 2.1 million unfilled jobs by 2030: this is the number of manufacturing positions that are likely to remain vacant in the United States due to a lack of skilled labour, representing $1 trillion in lost GDP (Deloitte & Manufacturing Institute)
- 5 to 20% of productivity is lost annually in an average manufacturing plant due to unplanned downtime (International Society of Automation)
- 64% of manufacturers are affected by skills shortages, which directly impacts their ability to meet customer demand (Accenture via AIS Corp)
Statistics: critical areas of inaction in production
Operational inefficiency in factories impacts various strategic aspects of industrial companies, each incurring specific costs. The industrial opportunity cost is especially clear in five areas where the existing conditions consistently harm performance. These friction points prevent managers from reaching operational excellence and obstruct digital lean management, which is vital for modern competitiveness.
| Area of inaction | Quantified impacts on productivity and efficiency |
| Maintenance & reliability | Reduction in maintenance costs of ~12% through preventive maintenance; Up to 30% reduction in machine downtime possible with proactive strategies (Worldmetrics, 2025). |
| Process optimization | 20–30% improvement in efficiency and 25% reduction in costs through process improvement initiatives (World Metrics, 2025). |
| Digitalization of management | Digitalization and process improvement, combined with organizational gains, lead to better customer retention: 50% of companies report improved customer retention following process improvements (World Metrics, 2025). |
| Training & skills | Well-run training programs can make employees up to 50% more productive than those who receive no training (SupplyGem, 2024). |
| Continuous improvement | Reduction in waste of up to 40% in organizations that implement systematic continuous improvement initiatives (WifiTalents, 2025). |
Note: These areas reinforce each other. A factory that combines several forms of inaction will therefore see its overall performance gradually deteriorate. Fortunately, structured industrial continuous improvement enables the identification and systematic addressing of these inefficiencies.

Discover why ops leaders choose Tervene to launch LSW
What are the direct consequences of inaction on industrial performance?
Loss of productivity and slower growth
Inaction causes a downward spiral in productivity. Employees waste a significant amount of time each week searching for information, repeating the same mistakes due to a lack of knowledge sharing, or handling malfunctions that could have been foreseen.
This ongoing inefficiency widens the gap between the company and industry standards. While competitors adopt lean methods and digitize their operations, companies that fail to take action see their performance metrics gradually decline.
Overall equipment effectiveness stalls, manufacturing lead times grow longer, and unit costs rise. The most harmful result is the loss of market share, as customers frustrated by lengthy lead times or inconsistent quality turn to competitors.
Increased financial and reputational risks
Financially, inaction increases hidden costs that are hard to track in traditional accounting systems. Dormant inventory consumes capital; rework and scrap reduce margins; and, over time, they offset structural inefficiencies.
The risks of non-compliance also grow over time. Regulations change, and customer requirements become more demanding, but companies that fail to adapt their processes risk penalties, lawsuits, and unfavourable audit outcomes.
Finally, the company’s reputation steadily declines. Repeated delivery delays, ongoing quality issues, and failure to meet commitments diminish customer confidence, which is hard to restore.
Demotivated teams and recruitment difficulties
The human toll of inaction is often underestimated. Employees who deal with unresolved issues daily feel helpless and frustrated. Why report a problem if nothing ever changes? This gradual loss of motivation leads to reduced commitment, increased absenteeism, and higher staff turnover.
Increased turnover results in direct costs (such as recruitment and training) and indirect costs (such as loss of skills and the time required to adapt). In a challenging industrial job market, replacing a skilled operator or experienced maintenance technician is both complex and costly.
Furthermore, companies that neglect ongoing improvement and modernization of their practices find it harder to attract new talent. Younger generations seek structured, digital, and performance-driven work environments.
How can you measure the cost of inaction? Example
The 5 key metrics for quantifying inaction
To turn your intuition into concrete data, you’ll need to do some math. Concentrate on these five measurable indicators, which precisely show where inaction is affecting your performance.
1. Performance gap compared to your competitors
Compare your OEE, scrap rate, and changeover time against industry benchmarks. A consistent gap of over 15% highlights a costly area of inaction.
2. Total cost of non-quality (COPQ)
Add up the costs of scrap, rework, customer returns, complaint handling, and sorting hours. This annual total shows what inaction on quality truly costs you.
3. Cumulative unplanned downtime
To assess the direct cost of inaction in maintenance, record the number of hours of unplanned machine downtime each month, then apply the following formula:
- Direct cost of downtime = Hours of downtime × (Hourly labour cost + Hourly machine cost).
- To also measure the opportunity cost of lost production, you can add: Indirect cost (lost margin) = Downtime hours × Hourly margin on lost revenue.
This distinction allows you to separate the actual costs incurred by the company (labour and machinery) from the financial impact on revenue and profitability, providing a comprehensive view.
4. Durée moyenne de résolution des problèmes récurrents
Measure the number of days between identifying an issue and its final resolution.
A duration exceeding 30 days indicates costly decision-making delays (the duration obviously depends on the scope of the problem and the project).
5. Implementation rate of action plans
Calculate the percentage of action plans resulting from tiered meetings, audits, or Kaizen projects that were actually completed on time. Ideally, the goal is to reach 100%.
Calculate your cost of inaction
To precisely quantify the cost of inaction in your particular context, use these calculation formulas tailored to each type of inefficiency.
| Type of cost | How to calculate it | Concrete example |
| Unplanned downtime | Downtime hours × (labor cost + machine cost + margin lost per hour) | 800 hours × (€150 + €80 + €200) = €344,000/year |
| Non-quality | (Defective parts × unit cost) + (sorting hours × hourly cost) | (5% × 100,000 × $15) + (200 hours × $45) = $84,000/year |
| Unproductive time | % of time lost × number of operators × annual hours × hourly cost | 20% × 25 × 1,600 hours × $45 = $360,000/year |
| Difference vs benchmark | Difference in OEE × available hours × hourly margin | (85% – 65%) × 10,000 hours × $120/hour = $240,000/year |
| Excessive turnover | (Current rate – normal rate) × workforce × average cost per departure | (25% – 10%) × 100 × $15,000 = $225,000/year |
| Unrealized projects | Number of projects × average gain per project | 15 × $8,000 = $120,000/year |
4 actions to reduce the cost of inaction
1. Digitize operational management
Centralize your production data on a single platform to speed up access to information and decision-making. Automate the preparation of management rituals (AIC, TOP) and structure the monitoring of action plans to ensure their effective completion.
Expected impact: reduction in time spent collecting data, simplification of communication, and improved responsiveness to deviations.
2. Standardize and continuously improve
Document your best practices and standardize processes to reduce variability among operators. Implement digital Kaizen projects to foster daily continuous improvement.
Expected impact: reduction in performance gaps, reduction in costs related to non-quality, and strengthening of your culture of continuous improvement.
3. Leverage data to anticipate
Shift from a reactive mindset to a proactive approach by analyzing your production data in real time. Anticipate breakdowns with predictive maintenance, identify quality deviations before they lead to significant waste, and support your investment decisions with data-driven management.
Expected impact: reduction in unplanned downtime, optimal intervention, and effective prioritization of resources.
4. Train and empower teams
Invest in ongoing skills development through training programs tailored to each employee’s level. Clarify roles and responsibilities within your management system and diligently track each action plan using project management tools.
Expected impact: Teams become agents of change, improving engagement and reducing turnover.
These four actions have one thing in common: they require complete visibility into your operational performance. Without a centralized platform, you waste valuable time on data collection, meeting preparation, and manual action plan tracking. That’s where Tervene comes in! By structuring your digital management system, the platform frees you from administrative tasks so you can focus on what really matters: identifying problems, quickly deciding on actions, and tracking their execution until results are achieved.
From inaction to performance with Tervene

The cost of inaction is a significant but often overlooked issue for industrial companies. Yet, as we have detailed, operational inefficiencies in factories cause considerable losses!
Fortunately, digital lean management, through a platform like Tervene, can support this transformation by providing teams with improved visibility and streamlining operations, particularly by centralizing information, standardizing routines, and enabling monitoring.
Evaluating the cost of inaction is the first step. Every day that passes without a diagnosis is a missed opportunity to understand your levers for improvement. Start by measuring, then take deliberate action.
Deploy your operational excellence program to reduce the cost of inaction
- Digitalize Leader Standard Work checklists and routines
- Track performance and site health metrics with visual management boards
- Implement a sustainable Daily Management System (DMS)
- Standardize meetings across your organization
FAQ – Your questions about the cost of inaction
The cost of not doing something is commonly referred to as the cost of inaction (COI). In economics, it is also linked to opportunity cost, which represents the benefits you forgo by not choosing a better alternative. In an industrial context, it includes lost productivity, higher operating costs, missed opportunities for improvement and growth, and widening competitive gaps. In short, inaction always carries a measurable financial and strategic impact.
The cost of inaction encompasses all financial losses and missed opportunities resulting from failing to act on identified problems.
In an industrial context, it includes productivity losses, additional operating costs, erosion of competitiveness, and missed opportunities for improvement. This cost is often invisible in the accounts but can represent 20 to 30% of revenue, according to studies.
The main causes include a culture of “we’ve always done it this way,” overly cumbersome decision-making processes, lack of visibility on real problems, lack of effective management tools, team overload, and lack of skills to drive change.
The fear of failure and the lack of clear prioritization of actions also contribute to perpetuating organizational inertia.
To measure the cost of inaction, first identify your main areas of inefficiency: maintenance, quality, and processes. Then, for each problem, calculate the frequency of occurrence and the unit impact (lost time, wasted material, etc.), then multiply by 12 months. Also, compare your performance to industry standards to assess the opportunity cost.
The sum of these elements provides an estimate of the annual cost of inaction.
- It depends on the situation, but in many industrial cases, inaction is costly. Delaying necessary action tends to worsen the situation: malfunctions increase, losses accumulate, and remediation costs rise. However, not all actions are equal.
The key is to diagnose correctly before acting, then execute actions in a structured manner rather than rushing or approximating.
- Delayed maintenance. Replacing a standard component that costs a few hundred dollars can turn into an emergency repair costing several thousand dollars and hours of production downtime.
- Non-optimized processes. Scrap or rework rates are significantly higher than industry standards, resulting in financial losses and potentially affecting customer satisfaction.
- Delayed digitization. Significant time is lost every day searching for information, communicating, managing projects, and preparing reports.
High turnover. Poor working conditions lead to recurring recruitment and training costs, not to mention a negative impact on brand image.
The extent of these costs varies by company size and sector of activity.
It depends on your starting point and the extent of the changes you make. The first visible improvements usually appear after a few months of implementing a structured management system, especially if you start with quick wins. It is recommended to start with quick-impact pilot projects to build momentum, while not underestimating the time required to truly transform work habits.
Tervene is a tool that helps reduce the cost of inaction. Specifically, the platform helps you to:
- Centralize your production data. You can access all your SQCDP indicators from a single point, without having to search across several systems.
- Structure your management rituals. The platform automates the preparation of your AICs and field rounds, then systematically monitors all your action plans.
- Speed up the flow of information. Teams instantly share data between departments, eliminating manual reports and back-and-forth emails.
- Free up managerial time. You spend less time collecting data, allowing you to focus more on analyzing problems and making decisions.
- Track responsibilities. Each corrective action has a clearly identified owner and a deadline visible to all team members, thereby avoiding misunderstandings and oversights.
The results depend on you! Tervene provides visibility and structure, but your ability to use this information to take concrete action determines the extent of the gains.